A confirmation message will appear, listing any map layers or project tables that use this data source.
Click OK to confirm and delete the data source.
The original data file used to create the DS is not deleted. It will remain available in the Files tab for 10 days, after which it will be automatically removed from JMap Cloud.
Feature Service
Coming soon.
Welcome
Welcome to the Documentation Hub for:
JMap Cloud Portal
JMap NG
JMap Cloud API
JMap Cloud Extensions
Vector Tile Service
Coming soon.
JMap NG User Guide
JMap NG is an interactive mapping application that allows you to visualize JMap Cloud projects, explore geographic data, and edit spatial and descriptive information.
I Want to...
JMap NG provides a range of tools that enable you to interact with and make full use of the application’s data.
Accessing JMap Cloud Portal
A JMap Cloud administrator in your organization will send you an email invitation to join JMap Cloud Portal. This email contains a link directing you to the account creation page.
The account creation interface displays your email address and a field where you can define your password according to the specified requirements.
Once you have entered your password, click Continue to proceed with the login process described in the next section.
If you already have an account, simply click Sign in to access the platform directly.
After your account has been created, you can access JMap Cloud Portal in two ways:
By visiting the main website: and clicking Sign in
By going directly to:
Signing in to JMap Cloud Portal
Click Sign in to open the authentication page.
Enter your email address and password, then click Continue.
If you are a member of more than one organization, a window will prompt you to select the organization you want to connect to. Click the corresponding button to access that organization’s JMap Cloud Portal.
The home interface displays the , which summarizes the platform resources available to you according to your permissions.
Managing the Organization
Administrative functions for the organization, including service subscription management, are reserved exclusively for Administrators.
Organization management is performed in the Organization section of JMap Cloud Portal, which is divided into several tabs:
Each tab contains settings and tools that allow administrators to efficiently manage the organization’s resources and members.
General
This section allows you to define your organization’s name and copy its unique identifier.
Enter the organization name in the Name field.
To copy the organization’s unique identifier to the clipboard (for example, to use it in an external configuration), click the copy icon .
The unique identifier is used, among other things, to establish connections between JMap Cloud and other systems within the organization, such as JMap Server. For more details, see the .
Open in Studio
You can open the project in Studio, the section of JMap Cloud Portal that provides the tools needed to create and configure the project's layers and data.
To do so:
Click the menu icon , then select Open in Studio.
The Configure project data section opens, giving you access to all the settings related to the structure and content of the project.
User Guide for JMap Cloud Portal
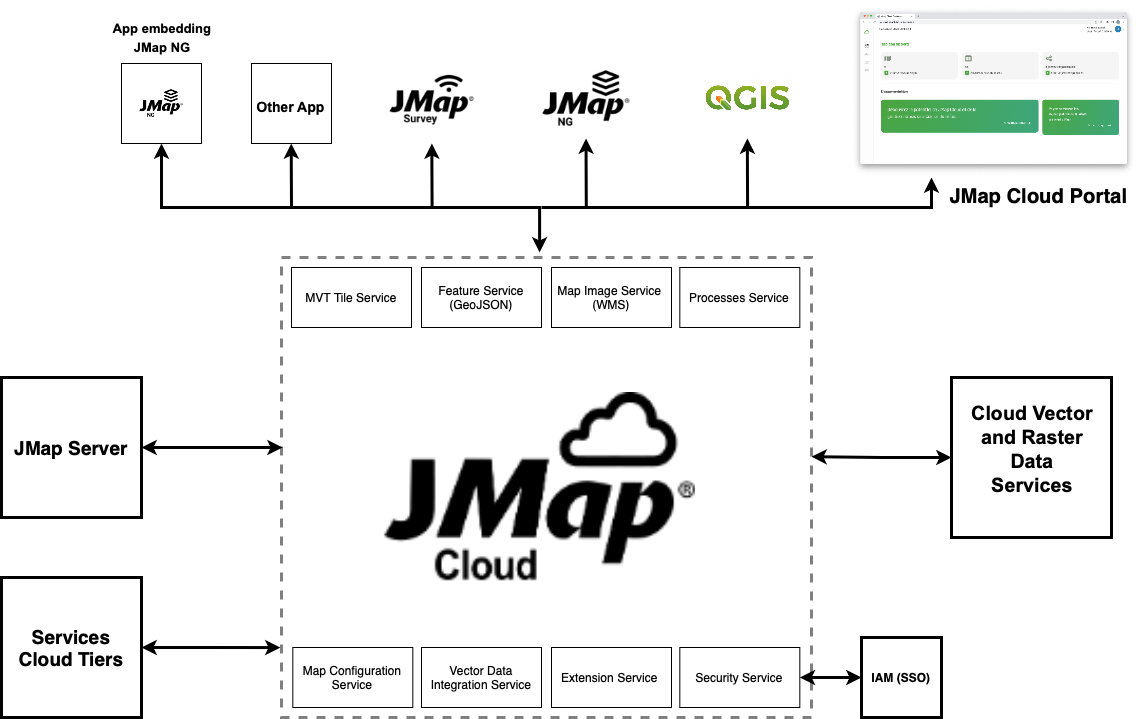
JMap Cloud is a cloud-based geospatial platform designed for developers and system integrators who need to add advanced mapping capabilities to their applications. It provides robust cloud services and APIs that facilitate the integration, visualization, and querying of heterogeneous geospatial data from multiple formats (vector, raster, web services) and sources (OGC services, local files, etc.), as well as the various mapping applications that connect to the platform.
The platform is built on containerized microservices that are interoperable and scalable. It complies with industry standards in the geospatial domain (OGC, GeoJSON, WMS/WFS, etc.), ensuring seamless interoperability with existing GIS systems and business applications.
The following diagram illustrates the JMap Cloud architecture, including its main services (authentication, data management, map rendering, etc.), its possible connections with an organization’s information systems (databases, internal web services) through JMap Server, and the front-end interfaces used by end users through mapping applications. The architecture diagram on page 2 shows these components and their interactions.
JMap Cloud Portal is the platform’s web-based management interface. It provides administrators and authorized users with advanced visual tools to:
Import geospatial and non-spatial datasets
Create, configure, and publish mapping projects
Manage users, roles, and access permissions
Monitor the technical ecosystem connected to JMap Cloud
In summary, JMap Cloud Portal centralizes the governance of an organization’s geospatial data and mapping services within a secure, flexible, and scalable cloud environment.
Deleting a Layer or Layer Group
You can delete a layer or a layer group from the project at any time.
To delete a layer or a group:
Hover over the layer or group you want to delete until the action icons appear.
Click the Delete icon .
If you delete a layer, it will immediately be removed from both the map and the Layers section.
If you delete a group, it will disappear from the Layers section, and all layers it contained will be moved to its former position in the list, outside of the group.
Resetting Map Display
This function restores the map to its default layer visibility settings.
While configuring a project, you may enable or disable certain layers to facilitate your work. When you click the Reset display icon , the map returns to its original display state based on the default visibility settings of each layer.
Approved Organizations
Sharing your organization’s data with other organizations can be useful when you want to use the same data without duplicating it.
If other organizations are also using JMap Cloud, you can identify them in JMap Cloud Portal and make them available for resource sharing.
This tab allows you to add organizations to your organization’s JMap Cloud environment.
Steps
Click Add Organization to open the configuration window.
Enter the organization’s ID. An administrator from that organization must provide this information.
Once the identifier is validated and the organization approved, its name appears in the tab.
Editors in your organization can then share their data sources with approved organizations. Sharing is configured in the section of the data source.
Data sources shared by approved organizations appear in the Data Sources section.
If an organization is removed from the list of approved organizations:
All permissions granted to data sources are removed.
Data sources shared by that organization are also removed.
Managing Data Sources
You can access several functions from a data source's menu : view its information, edit its configuration, update the data, manage permissions, or delete the source.
The following sections provide detailed descriptions of each function.
Adding a Layer Group
Layer groups help organize project layers in a clearer, more structured way, based on various criteria such as theme (sewer network, transportation, regulations, etc.), time period (current year, archive, etc.), or other organizational needs.
To add a layer group to the project:
Click the Add Group icon. A new group named Layer group will appear in the Layers section.
Double-click the group name to edit it. Click on each language label to enter the name in the supported languages.
Select the layer you want to add to the group.
Press the layer’s icon , then drag and drop it into the desired group.
Open in JMap NG
You can open a project in the JMap NG application to explore its content and fine-tune its configuration before making it available to end users.
To do so:
Click the menu icon, then select Open in JMap NG.
The JMap NG application will open in a new tab, displaying the selected project.
Log in using your JMap Cloud Portal credentials.
Navigate through the map and explore the available features.
JMap NG is the map application used by users with the Viewer role to access shared projects. For more details, refer to the .
To close the application, click the icon and select Log out.
Controlling the Display of a Layer or Layer Group
Two tools allow you to manage how layers and layer groups are displayed:
One tool lets you turn the display on or off for a layer or group on the map.
The other allows you to enable or disable the visibility settings configured for the layer or group. These settings are described in detail in the Properties section.
To access these functions:
Hover over the desired layer or group to reveal the action icons.
Click the or to turn the display on or off for the layer or group.
Click the or to enable or disable the application of visibility settings n the project layer configuration.
Introduction
This guide describes the main steps involved in publishing data through a JMap Cloud mapping application, whether public or restricted.
Within an organization, each user is assigned one of three roles in JMap Cloud: Administrator, Editor, or Viewer. The section describes the responsibilities associated with each role.
Only Administrators and Editors can access JMap Cloud Portal, the platform’s data management interface. Some management operations, however, are restricted to administrators.
Viewers, on the other hand, access only the mapping applications that publish the data, such as JMap NG Cloud.
The diagram below illustrates the general workflow and highlights the roles involved at each step.
Connecting Data: Data Sources
The first step in the map‑publishing workflow is to connect JMap Cloud to your data by creating data sources (DS).
A data source is any service or file that provides information to JMap Cloud, including:
Spatial data (vector or raster)
Non‑spatial tabular data
Extensions
This section displays the extensions that add specific functionality to JMap Cloud projects.
Each extension is displayed as a card containing the following information:
Extension name
Publisher organization
Status of a Data Source
The table presents the different statuses that can have a spatial data source.
Creating Data Sources
You can create data sources (DS) from five types of support:
Vector or raster data files: Various formats are supported (SHP, CSV, GML, GeoJSON, FileGeoDB, GeoPackage, DWG, TAB, GeoTIFF)
Non-spatial tabular data files
Focusing the Map on a Single Layer
When many layers are visible in a project, the map may become harder to read.
The Focus mode allows you to display only one layer at a time, without having to manually turn off the others. So you can configure the layer without interference from other layers.
Once this mode is enabled, only the selected layer is shown on the map. You can easily switch the focused layer or turn off Focus mode to return to the default view.
To use Focus mode:
Click the
Organizing Data into Projects
Once the data is connected, the next step is to organize it into projects, which can then be published to end users through mapping applications.
A project consists of an ordered list of map layers and non-spatial tabular data. JMap Cloud mapping applications open these projects to display their content. You can create as many projects as needed to meet your requirements.
Each layer in a project is linked to a , which provides the data for the layer. It is possible to:
reuse the same data source across multiple projects, each with different styles or filters,
Managing Projects
Projects that you have created (and therefore own), as well as those for which you have access permissions, are displayed in the Projects section.
Two display modes are available:
The table view, similar to the one used for other resources in JMap Cloud Portal
The card view, which displays projects as tiles
Get the Public Link
When the visibility of a project is Public, users access the project without the need for authentication.
When visibility is Private, users must have at least View permission to access the project.
To obtain the sharing link to share a public project:
Click and then on Get the public link. This function is inactive for projects with Private visibility type.
Updating Data
You can update the data of a vector/raster spatial data source or a non-spatial data source. This process allows you to replace the file that provides data to the data source (DS).
1. Open the Update Interface
Select the Update Data function to access the interface where you can:
upload a new file,
Configuring a Layer
Each layer's configuration panel provides tools to define general properties, styling, labels, and tooltips. The available options vary depending on the type of layer—vector or raster.
Icons allow you to access each of these sections.
Form Layout
The Layout tab provides tools to visually arrange the components of your form.
By default, components are stacked vertically. The layout tools allow you to customize this structure by using containers that define flexible layouts. These containers can hold other containers or components, enabling highly customizable form designs.
To add a container, drag it from the panel and drop it into the Design tab interface at the desired location. Guide lines will appear to help you place the container in valid positions.
This approach allows you to create an infinite variety of simple or complex layouts.
Groups
This section displays a table of member groups and provides a button for creating new groups.
When an organization has many members, grouping them according to specific criteria simplifies permission management.
Only individual members can own resources such as data sources or projects. Groups cannot own resources.
The table displays each group’s name and the number of members it contains.
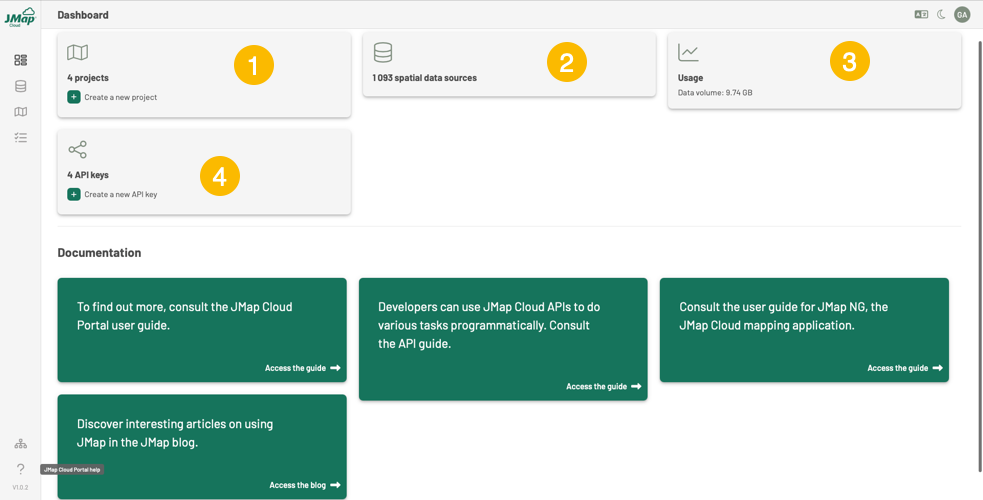
Dashboard
The Dashboard is the home section of JMap Cloud Portal. As its name suggests, it provides an overview of resources such as projects and data sources, and also allows some resources to be created directly.
The dashboard interface presents several cards summarizing the organization’s resources.
Setting the Order of the Map Layers
The layer order on the map determines how layers are drawn on top of each other. The bottommost layer is rendered first, followed by the one above it, and so on, until the top layer, which is drawn last.
This order is important because it affects layer visibility, depending on the transparency or type of the layers. For example:
A raster layer placed at the top may obscure those beneath it.
Setting the Initial Extent
You can set the project’s initial extent, meaning the geographic area displayed by default when the project is opened in a JMap NG application or in Studio.
To set the initial extent:
Activate the tool by clicking the icon in the Define an initial extent section.
Click once to start drawing the rectangle.
Settings
To view or modify a project's settings:
Click , then select Settings. The project configuration interface will appear.
Make the desired changes to the settings. All settings are editable.
Adding Data
To add data to a project, select a data source, then drag and drop it onto the map.
You can add the same data source multiple times—each instance creates a new spatial layer or a tabular dataset within the project.
Spatial data appears in the project’s Layers section.
Tabular data appears in the
Establishing the Order of Layers in the Layers Panel of Studio and JMap NG
The layer order in the Layers panel of Studio and JMap NG helps improve usability, especially in projects with a large number of layers.
To rearrange layers in the panel:
In the Layers panel, hover over the layer you want to move until the icon appears.
Layer Information
To display layer information:
Click the menu icon, then click More information to open the GENERAL panel.
Displayed parameters:
Number of features visible on the map (varies depending on navigation).
Introduction
Get started with JMap NG by following these steps:
Log in – Access the application using your credentials.
Explore the Interface – Become familiar with the user interface.
Organizing Layers
The Layers section provides various tools to help organize the project’s layers, making it easier for end users to interact with the map in JMap applications.
Each layer and layer group also includes display controls, allowing you to manage what appears on the map.
Specifically, you can:
Define the display order of layers on the map.
Geographic Extent
To display the geographic extent of a layer, even if it is not visible on the map:
Click the menu icon, then click Show layer extent. The map automatically zooms to the layer’s geographic extent. A rectangle outlining the extent briefly appears.
Click the Back icon to return to the previous geographic extent.
Creating and managing data: forms
Users of JMap NG applications can, depending on their permissions, create or modify data. These operations are carried out using forms configured in JMap Cloud Portal for both spatial and non-spatial data sources.
The Forms section displays a table listing the configured forms associated with the data sources you have access to.
The Create a new form button opens an interface that allows you to:
select a data source,
Deleting the project
You can delete a project if you have Ownership permission.
Deleting a project also removes its map layers and all related configurations.
To delete a project:
Click , then select Delete.
A confirmation message will appear.
Making Layer Features Selectable
To use certain functions such as interactive selection, you must first make the layer features selectable.
Hover over the layer card to display the Selection icon .
Click the Selection icon to make the features selectable. The icon remains visible on the card.
Edit Data
You can edit data in map layers (spatial data) as well as in tables (non-spatial data).
You must have the appropriate permissions to perform the different types of editing operations.
Types of Editing – Map Layers
Examples
The following pages contain source code examples that you can run or modifiy in Codepen.io.
In all examples, you must import the JMap NG core or app library from our CDN with a command like this:
or
The specific version of the library that you import must match the version of your backend. For JMap Cloud, always use version 'jmapcloud'. For JMap Server, use the version that matches your setup (for instance, 7_Jakarta_HF6 or 7_Kathmandu_HF3). New versions of JMap NG libraries are published for each release of JMap Server.
Filtering Features
Filters can be applied to display only the layer features whose attributes match certain criteria.
Your organization’s administrators have configured filters to allow you to quickly display specific features of interest.
If a filter is applied to a layer by default, the Filter icon is displayed.
Managing Filters
Version
Description of available features
Representative image
Link for additional information
A toggle switch allows you to enable or disable each extension globally for your organization.
For extensions to be available in JMap NG applications, they must be activated at two levels:
Organization level – Activation makes the extension available for projects. This is done in Organization → Extensions.
Project level – Activation makes the extension available in the JMap NG application. This is done in Projects → Extensions.
Available extensions and connectors may change over time.
Examples of extensions include:
Dashboard – Displays dynamic charts representing metrics calculated from map data. Metrics update in real time as users navigate the map.
Geoselec – Identifies aerial images available for a selected area and provides access to the Geoselec catalog.
Jakartowns – Allows browsing panoramic images and data provided by the Jakarto platform.
NG Configuration – Allows JavaScript developers to customize the JMap NG mapping interface.
Terrain – Provides terrain analysis tools such as slope calculation, elevation, cut-and-fill volumes, and cross-sections based on a digital terrain model.
WMS/WMTS services
Vector tile services
Feature services
The Data sources tab allows you to create and manage the data sources you will use in your projects.
This section displays a table listing the data sources you own, as well as those you have permission to access. For more details on access and resource management, see the Permissions section.
Each data source appears as a row in the table. The columns provide the following information:
Name of the data source
Source type
Status
CRS (Coordinate Reference System)
Number of features (for vector and tabular data sources)
Tags
Last modified date
Creating a Data Source
To create a new data source, click the Create a data source button. A dropdown menu will allow you to select the source type:
Vector/Raster data file
Tabular data file (non-spatial)
WMS/WMTS service
Vector tile service
Feature service
The following steps will vary depending on the selected source type.
select an existing file already stored in JMap Cloud.
If the selected file is not compatible with the existing data source, an error message will appear.
2. View and Edit Information
The interface displays the current properties of the data source:
Name,
Coordinate Reference System (CRS) (for spatial DS),
Description,
Tags.
You can keep these values as they are or update them as needed.
3. Review and Configure Attributes
The attributes of the new file are shown. You can index specific attributes to facilitate searches.
Depending on the file format, some additional parameters must be completed. These are explained in the spatial data file and tabular data filesections.
A new table is created in JMap Cloud with the updated data. The previous table is automatically deleted.
4. Finalize the Update
Click Save. Once the changes are applied, the status of the data source is updated to Ready.
If the CRS of the new file is different from the one configured for the data source, the data will not be displayed on the map when using the View Information function.
5. Impact on Map Layers
The new file may differ from the original in terms of format, CRS, geometries, or attributes.
In such cases, you will need to update the configuration of the map layers that use this data source.
Navigate the Map – Learn how to move efficiently within the map.
Set Up Your Profile – Configure your account settings for a personalized experience.
Set the layer order in the Layers panel of Studio and JMap NG.
Focus the map on a single layer by displaying it exclusively.
Add layer groups.
Remove a layer or a layer group from the project.
Control the visibility of individual layers or groups on the map.
assign a name to the form,
and add tags.
Clicking Create takes you to the form design interface, which is described in detail in the following section.
Each form includes a menu that provides the following options:
Settings: View the associated data source and modify the form’s name and tags;
Edit form: Opens the form design interface (see the next section for more information);
Delete: Permanently removes the form.
Create a new feature
Modify a feature’s geometry
Modify a feature’s attribute values
Create, edit, or delete values in a table associated with a feature (subform)
Attach documents to features
Delete one or more features
Types of Editing – Non-Spatial Data Tables
Create a new record
Modify the field values of one or more records
Attach documents to records
Delete one or more records
The following sections describe each of these functions in detail.
or use the same data source multiple times within a single project to show different filtered views of the same dataset.
This flexibility enables a customized and targeted presentation of your data while optimizing reuse.
Projects are secure resources: permissions can be assigned to control user access. This allows for precise management of who can view or interact with each project.
The Projects section of JMap Cloud Portal allows you to create and manage your projects. Projects can also be created directly from the Dashboard.
The following sections describe the steps to create a new project and how to manage the projects you have access to.
JMap NG projects can contain two types of data: spatial data and non-spatial data.
Spatial Data
Spatial data is organized into map layers. Each layer contains data on a particular theme. These layers are overlaid to form the map displayed in the interface.
Types of Cartographic Layers
Vector Layers
Vector layers are composed of features represented by geometries (points, lines, polygons) and descriptive attributes.
Example: A tree layer represented by points, with attributes such as species, diameter, height, and health status. Each tree thus has a geographic position and characteristics that describe it.
Raster Layers
Raster layers are composed of pixel-based data forming images, such as aerial photographs, satellite imagery, and digital terrain models.
Hierarchical Organization
Layers can be grouped hierarchically by theme: urban planning, environment, transport, etc. This multi-level structure facilitates navigation when projects contain numerous layers.
Base Maps
Base maps provide a visual context for presenting your data. Your interaction is limited to selecting which base map to display.
Non-Spatial Data
Non-spatial data in the project is organized into tables. This tabular data can be linked to map layers or be completely independent.
A table contains rows (records) and columns (fields or descriptive attributes).
This container creates a row in which multiple components or containers can be placed side by side.
Vertical
This container creates a column, where components or containers are arranged one above the other.
Group
This container allows you to group components or containers, helping to structure long or complex forms.
Click the group container to set a title in the Properties section.
Tab
This container lets you create tabs to better organize forms with many components.
Tabs can be placed inside other containers. Click the tab container to edit its default title in the Properties section.
Space
This container adds spacing between two components or containers, useful for improving the visual clarity of the layout.
In this first step, the Editor integrates data into JMap Cloud by creating data sources. These sources may originate from GIS files, spatial data servers, satellite imagery, or non-spatial tabular files.
Data can be:
Uploaded and copied into the internal JMap Cloud databases
Dynamically connected through external web services
Accessed through data sharing with other organizations
These sources then become available for project configuration.
Once the project is finalized, it can be published to end users through JMap NG mapping applications.
Depending on the security settings defined by the editor:
The application can be public
The application can be restricted to authenticated users with the Viewer role
For more information about these applications, see the JMap NG User Guide.
Extensions developed by various software vendors can also be added to projects to provide additional functionality for the applications that publish the data.
The Extensions section lists the extensions available for projects.
JMap Cloud supports several types of data sources:
Spatial DS
Vector files (GeoJSON, Shapefile, etc.)
Raster files (e.g., GeoTIFF)
WMS / WMTS services
Vector tile services
Feature services (OGC)
Non‑spatial DS
CSV files
Synchronization with JMap Server
A JMap Server administrator can synchronize data sources, layers, or even entire projects from a JMap Server instance into JMap Cloud. For more details, see the .
In the Data Sources section of JMap Cloud Portal, you have tools to:
Upload files (vector, raster, or CSV) to create new data sources.
Configure direct connections to external data services (WMS, WMTS, vector tiles, feature services).
Once created, these data sources are immediately available for creating map layers and tables within your projects.
Preparing
Files only.
Once the file characteristics have been validated and the data source parameters have been completed, the data is loaded into the JMap Cloud databases.
Processing
The data source is being updated.
Ready
The spatial data source is ready to use.
Error
Indicates an error in one of the steps of creating or updating the DS.
Through the menu you can update the SD to fix the error.
Uploading
Files only.
The file is being uploaded to JMap Cloud.
Analyzing
Files only.
The file is being analyzed. JMap Cloud detects file characteristics such as file type, CRS, attributes, etc.
Analyzed
Files only.
The file has been analyzed and its characteristics must be validated by you.
Focus Mode
icon
to enable the feature.
Click the name of the layer you want to display alone.
The layer configuration panel opens, and only that layer is displayed on the map.
Click the back arrow to return to the Layers panel.
All visible layers are shown again, but Focus mode remains active.
Click on another layer to focus on it.
To exit Focus mode, click the in the layer configuration panel.
The map returns to its default state, displaying all enabled layers.
You can switch between these modes using the corresponding icons, and .
In table view, you can sort and filter projects by name or last modified date.
For each project, the following information is displayed:
Project name
Number of layers
Visibility (public or private)
Each project includes an options menu that gives access to the following management functions:
The following sections describe each of these features in more detail.
You can copy this link also from the project configuration interface. This is relevant when you make a project Public:
Click and then on Edit to open the project configuration interface.
If you have Owner permission, check the Public box to make the project public. The icon appears next to the box.
Click to copy the project share link to the clipboard.
The map reflects real-time configurations.
The settings to configure depend on the data source type. The SD properties and focus mode are available for all data source types. You can configure the style, labels, tooltips, and filters for layers from vector data sources. Only the style is configurable for layers from raster data sources.
1
Sections:
Layer properties
Styles
Labels
Popups
Layer filters
Focus mode: click on this to applay the focus mode to the map.
2
Each section displays the settings to configure. These vary depending on the layer type, vector or raster, and the elements of the vector layer: points, lines, polygons, annotations.
3
Creating a Group
Click Create Group.
Enter the group name (between 2 and 250 characters), then click Create.
The group name must be unique within the organization.
The group then appears in the table.
Editing a Group
You can modify a group’s name and its members:
Hover over the group name, open the menu, and select Edit.
Change the group name and click Save (or cancel the modification).
To add a member, use the Member name or email field to select a member from the list.
Click Add to include the member in the group.
To remove members, select them and click Remove .
Deleting a Group
Open the menu for the group.
Select Delete.
Confirm the deletion.
Deleting a group does not affect its members, who remain active in the organization.
3
Usage
Displays the organization’s data usage.
The calculation includes files, database storage, converted raster files, and vector tile caches.
Only members with the Administrator role can see this card.
4
API Keys
Displays the number of API keys configured by your organization.
Only members with the Administrator role can see this card.
You can create a new API key using the Create new API key button .
1
Projects
Displays the number of projects you can access, either because you are the owner or because you have permission to access them.
You can create a new project using the Create new project button .
2
Data Sources
Displays the number of data sources you can access, either because you are the owner or because you have access permissions.
A polygon layer can hide point or line layers if it’s rendered afterward.
To change the layer order on the map:
Click the Layer Order icon to activate the tool.
In the Layer Order window, select the layer you want to move by clicking its name or the drag icon (arrows) to its left.
Drag the layer to the desired position and drop it.
The map updates automatically to reflect the new order.
Draw the desired area, then click again to finish.
Click the confirmation icon to save the extent.
Click Update to save your changes.
The modification date will appear in the Modification column when the project is displayed in List view.
Tabular Data
section.
Once the data is added, you can organize and configure the layers as needed.
Click the icon , then drag and drop the layer to the desired position.
The map itself remains unchanged, but the Layers panel reflects the new order.
Extent: X and Y indicate the position of the southwest point; width and height indicate the extent in meters from that point.
Metadata: Information about the data (quality, accuracy, completeness, producing organization, update dates, and related information). Note: Metadata may be unavailable.
Transparency (raster layers only): Adjust the transparency level using the slider, from 0% (default value) to 100%.
Click Back to return to the Layers panel.
Once confirmed, the project is permanently removed from the Projects section.
Click the Selection icon again to make the features non-selectable. The icon disappears.
Click the Filter icon (if a filter is active) or click the menu, then select Filter Features on the Map to open the FILTER(S) panel. The available filters are displayed.
Use the toggle switch to enable or disable each filter. The map displays the results in real time. Filters are applied in the order in which you enable them.
This section displays a table listing all API keys configured for your organization.
For each key, the table displays the following information:
Title
Unique identifier (ID)
User who created the key
Creation date
Expiration date
A contextual menu in each column header allows you to sort, filter, hide, or display attributes according to your needs.
Adding an API Key
Click Add Key.
Enter a name and expiration date, then choose the role assigned to the key (only Editor and Viewer roles are available). Fields marked with an asterisk (*) are required.
Click Create.
A message reminds you that the key is private and will no longer be accessible after the window is closed.
Make sure to copy it immediately using the copy icon if you need to use it elsewhere.
Click OK to complete the creation. The key is then added to the table.
Managing API Keys
To manage an API key, hover over its row to display the contextual menu, then click it to access the available options:
View information
Delete
The information view displays:
Title
Creator
Role
Email address
You can copy the email address using the copy icon.
Deleting an API Key
You can delete API keys that are no longer needed. However, be aware of the implications: a key may own resources such as data sources, projects, layers, or tables.
Before deleting a key, make sure to transfer ownership of its resources to another member of the organization. Otherwise, the resources will be deleted along with the key.
Deletion steps
Click the menu and select Delete.
Confirm your intention in the dialog box.
If the key owns resources, a list of members with the Editor role will be displayed. Select the member to whom the resources will be transferred.
The selected member becomes the owner of all transferred resources. Access permissions associated with the deleted key are removed.
Resources without another owner will be permanently deleted.
Deleting an API key is irreversible. The key is permanently removed from JMap Cloud.
WMS/WMTS Service
Web Map Service (WMS) and Web Map Tile Service (WMTS) are two standards defined by the Open Geospatial Consortium (OGC). They specify how applications should send requests to obtain maps from compatible servers.
WMS servers use the HTTP protocol to return map images in common raster formats such as PNG, JPEG, or GIF.
Server capabilities are described in an XML document that outlines the supported request types, available layers, supported projections, and other metadata.
WMTS servers, on the other hand, deliver maps as predefined tiles, enabling faster and more efficient rendering, particularly for large-scale navigation.
JMap Cloud can query servers that comply with either the WMS or WMTS standard to create spatial data sources, allowing you to integrate external map layers into your projects.
The settings you need to complete are as follows:
Members
This section displays a table of organization members and includes a button to invite new members to JMap Cloud.
For each member, the table displays:
Name
Identifier
Email address
Role
Groups the member belongs to
A contextual menu available when hovering over a member’s name allows you to perform actions such as viewing information, editing properties, or deleting the member.
Another contextual menu in the column header allows you to sort, filter, hide, or display table attributes.
Adding a Member
To invite someone to join your organization:
Click Invite Member.
Enter the person’s email address.
Select the role and groups to assign to the member.
A message confirms that an invitation email has been sent.
If needed, you can copy the invitation link using the copy icon .
Close the window. The invitation will appear in the Invitations tab.
Viewing and Editing Member Information
Hover over the member’s name and open the contextual menu.
Select Display Information to see details such as name, email, role, and groups.
Click Update to update the member’s role or groups.
Deleting a Member
Members with the Administrator or Editor role may own resources such as data sources or projects.
When deleting such a member, you must decide what happens to those resources.
Steps
Click Delete.
Select Transfer ownership to, then choose another member from the list to receive the resources.
Click Delete to confirm.
Effects:
The member’s access permissions (ACL) are removed.
The selected member becomes the new owner of the resources.
You can also choose to delete the member without transferring ownership:
The member is deleted.
All resources owned by the member (and their dependencies) are also deleted.
Associated permissions are removed.
Deleting a member prevents them from signing in to JMap Cloud.
Member deletion is irreversible and permanently removes the user from the organization’s identity management system.
Non Spatial Tabular Data Files
JMap Cloud allows you to create data sources (DS) from CSV files containing tabular data without spatial components. These datasets can later be linked to spatial data if needed.
If the CSV file includes fields with values that correspond to X and Y coordinates, you can choose to process the data source either as spatial or non-spatial.
Creating a DS from Tabular Data Files
Creating a data source is done in several steps:
1. File selection
In the Data Sources tab, click on Create a data source.
Select the Tabular data file (non spatial) option.
Choose between:
2. Uploading
When uploading a new file, JMap Cloud automatically analyzes its metadata (format, structure, data types, etc.) before displaying the configuration window.
If you choose an existing file, the analysis has already been completed and the configuration window opens immediately.
3. Configuring DS Parameters
For details on the configurable options, refer to the section.
You may also add a description and tags to help filter and organize your data sources. To create new tags, simply type them into the Tags field.
4. Finalizing the DS
Click Create to launch the process. The new data source will appear in the list. Its status will first display as Preparing, then switch to Ready once the process is complete.
Once a data source is created for a file, the file is no longer required as the data is transferred to the JMap Cloud databases. All uploaded files are automatically deleted after 10 days.
File Settings
The table shows the general settings to configure when creating an DS from tabular data files.
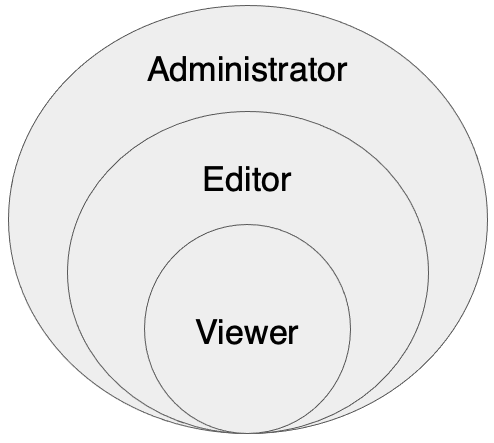
Roles
Roles in JMap Cloud define user categories, each associated with a specific set of permissions for accessing and modifying an organization’s resources.
Each organization member is assigned one of the following roles:
Administrator
Editor
Viewer
These roles determine which features are accessible and which sections are visible in JMap Cloud Portal.
Only Administrators and Editors can sign in to JMap Cloud Portal. Viewers interact only with the applications that publish the data configured in the portal.
The diagram illustrates the relationship between these roles.
Administrator
The Administrator is responsible for managing the organization in JMap Cloud Portal, including users, API keys, and organizational settings.
Administrators can:
Create, modify, and delete API keys
Configure organization settings
Invite new members
Manage member roles (assignment and modification)
All these functions are available in the Organization section. The chapter describes each function in detail.
Administrators can also quickly create API keys directly from the .
Administrators also inherit all Editor privileges.
Editor
The Editor does not have access to administrative functions but is responsible for configuring projects published through JMap NG applications.
Editors can create, configure, modify, and delete the following resources:
Data sources
Projects
Map layers and non-spatial data tables
Forms
These tasks are performed through the , , , and sections of the portal.
Editors also inherit all Viewer privileges.
Viewer
The Viewer is an end user who accesses data through JMap NG applications and does not have access to JMap Cloud Portal.
Viewers can:
View projects and their data
Navigate the map and interact with data (selection, information display, etc.)
If permissions are granted, edit geometries and/or attributes of a layer or non-spatial data table.
Invitations
This section allows you to create and manage invitations for people who want to join your organization on JMap Cloud.
A table lists all invitations sent from this tab or from the Members tab, displaying:
Invitation ID
Sender email
Recipient email
Creation date
Expiration date
A contextual menu allows you to view details or delete an invitation.
Another menu in the column header allows you to sort, filter, hide, or display columns.
Inviting a Member
Click + Invite Member.
Enter the recipient’s email address.
Select the role (Administrator, Editor, or Viewer) and the groups assigned to the member.
A window confirms that the invitation was sent. You can copy the invitation link using the copy icon .
Close the window. The invitation will appear in the invitations table.
Invitations expire after 7 days.
Viewing or Deleting an Invitation
Open the menu on the invitation row.
Select Display Information to display details such as:
Guest email
Invited Members
The invited user receives an email from JMap Cloud containing:
The sender’s name
The invitee’s email address
The organization name
An invitation link
By clicking either link, the user is redirected to the Accept Invitation page where they can define a password and .
If the invited user receives the Administrator or Editor role, they can access JMap Cloud Portal.
If they receive the Viewer role, they can access projects through JMap NG applications, depending on their permissions.
Layer Properties
This section allows you to configure the layer properties, through the following parameters:
Source
Indicates the layer's data source.
Click the data source name to open the data source description interface.
Name
The name of the layer.
You can modify the name.
Description
Description.
Optional parameter.
The language button allows you to select the available languages to provide the information in each language.
Layer Filters
This feature allows you to filter the features from a data source so that only those meeting specific criteria are included in the layer. This enables you to create multiple layers based on the same data source, each showing a distinct subset of features.
Filtering is done using conditions. Only features that satisfy the defined conditions will be displayed in the layer.
The Filters section, accessible by clicking the icon, allows you to configure the conditions applied to the layer.
1
Click + to add a condition.
Filter operators
The operator filters DS elements to conserve in the layer the elements whose:
equals: attribute value (regardless of its type) is equal to one of the specified values.
does not equal: attribute value (regardless of its type) is different from the selected values.
greater than: attribute value (numeric or date) is greater than the selected value.
greater or equal to: attribute value (numeric or date) is greater than or equal to the selected value.
less than: attribute value (numeric or date) is less than the selected value.
less or equal to: attribute value (numeric or date) is less than or equal to the selected value.
contains: attribute value (text) contains the selected value.
does not contain: attribute value (text) does not contain the selected value. This is the same as making a query with the WHERE clause attribute_name NOT LIKE '%value%'.
is null: attribute value (regardless of its type) is null.
is not null: attribute value (regardless of its type) is not null.
is between: attribute value (numeric or date) is within the range defined by the two entered values.
is not between: attribute value (numeric or date) is not within the range defined by the two entered values.
User Profile and Settings
The Profile and User Settings panel lets you customize your experience in JMap NG.
Access Your Settings
To access the settings, click the User icon in the sidebar to open the Profile and User Settings panel.
Edit Your Profile
Change Your Name
Click the icon next to your name to edit it.
Change Your Password
Open the Change password menu.
Enter your current password.
Enter your new password.
Customize the Interface
Application Theme
Select your preferred theme (light, dark, etc.).
Measurement Units
Select your preferred distance units from the dropdown menu. These units will be applied to the map scale as well as distance and area measurements.
Application Language
Click the icon to display the available languages and change the application language.
The change may take a few moments as it affects both the interface and the data (layer titles, attribute names, tooltip content, etc.).
Sign Out
Click Sign Out to close your session. You will be redirected to the JMap NG login page.
Close the Panel
Click the arrow to close the Profile and User Settings panel, or click another icon in the sidebar to open a different panel.
Form Design
Each form is linked to a data source, whether spatial or non-spatial.
Forms are built using components arranged in either simple or complex layouts, depending on the requirements. In most cases, each form component is directly associated with a field or attribute from the data source, which is accessed through the layer or table connected to that source in JMap NG.
The form design interface allows you to define both the content and the layout of the components.
The illustration below shows the main sections of the form design interface.
Connecting to JMap NG
Access the Application
You can access JMap NG from any modern web browser (Edge, Google Chrome, Firefox, Safari) using the URL provided by your organization.
First Login
If the app has controlled access, you will receive an email invitation to join your organization on JMap Cloud. To activate your account:
Respond to the invitation.
Create a password to complete your profile.
Log in with your credentials.
A security message may appear during your first visit. If so, follow the on-screen instructions and click the Open JMap NG button.
Select a Project
Once logged in, the home interface allows you to select the project you wish to view.
You only see projects you have access to.
The default interface language is based on your web browser’s language.
Click the language icon at the bottom to change JMap NG's display language.
Use the search field to quickly filter and find your project.
Click a project to open it.
The JMap NG version and the connected JMap product (e.g., JMap Cloud) are displayed at the bottom of the page.
Configuring Project Data
Studio is the section of JMap Cloud that allows you to configure a project by adding spatial or tabular data, and by organizing and configuring layers.
The Studio interface is accessible from the project menu by selecting Open in Studio.
1
Project name.
The following sections describe the available features in detail.
Styles
Layers can have different styles: the appearance of features varies based on one or more attributes.
When a layer has multiple styles, the number of configured styles appears on the layer icon. You can display multiple styles simultaneously, and styles may vary depending on the map scale.
Managing Layer Styles
Click the layer icon or click the menu icon, then select Styles. The STYLES panel displays the layer styles with their legend.
Use the toggle switch to enable or disable each style. The appearance of features changes accordingly.
Uncheck one or more classes or categories within a style to hide features belonging to those classes.
Click the Expand/Collapse icons to open or close the style card.
Click Back to return to the Layers panel.
JMap NG Developer Documentation
This manual is for developers who want to use JMap NG to create map visualization applications for the web, integrate mapping capabilities into their web applications or extend existing JMap NG tools. JMap NG connects to your instance of JMap Server and opens JMap projects.
Depending on the needs, one of two different approaches may be selected: using JMap NG Core or using JMap NG App.
Both JMap NG Core and JMap NG App can be easily embedded in you web applications or web sites. This manual explains how to do it and provides running examples that you can use to get started.
JMap NG Core
JMap NG Core is a library for building map visualization applications for the web. It connects to a JMap Server instance to load and display a map project. It is based on the open source project. It does not include any UI except for the mouseover popups and basic map controls. It is useful when you need only the map but want to build your own UI around it.
JMap NG Core provides a JavaScript API to perform simple tasks and JMap related tasks like getting a JMap Project, managing layers and accessing feature attributes. It also exposes the full MapLibre GL JS API for other tasks.
The latest version of the JMap NG Core Javascript API documentation is available .
JMap NG App
JMap NG App is a complete map visualization application based on JMap NG Core. It provides a complete UI with many ready to use tools such as measuring, selecting, editing features, printing. It does not require any programming but provides a JavaScript API and can be extended by writing JMap NG extensions. JMap NG extensions are modules that plug easily into JMap NG to extend its capabilities, perform custom tasks or to support the integration of JMap NG into another web application.
The latest version JMap NG App Javascript API documentation is available .
Configuring a Data Table
The configuration panel for each non-spatial data table provides tools to define the general properties of the table as it will appear in the JMap NG application.
1
Click on the DS to open its interface.
2
Table name
You can modify it by clicking .
3
Extensions
Extensions are plug-ins for JMap NG App that extend its functionalities. With the JMap NG API, you can develop your own extensions.
Extensions can add their own UI, typically an icon and a side panel. It is possible to have extensions with a different UI and even with no UI at all.
NG Extensions are javascript objects that respect an interface (either JCoreExtension or JAppExtension) and that are loaded by NG at application startup or project load, depending on the type of the extension. Every extension must have a unique id property, a initFn implementation, if implementing JCoreExtension, and a onPanelCreation implementation if implementing JAppExtension.
Extension life cycle
Extensions are being "registered" by NG in 2 different ways:
if included in the JMap NG , they will be automatically registered by NG.
If loaded from a javascript <script> tag or via a project load, the extension must register itself. This is typically done in the extension "entry point" by calling the method, for a Core extension, or method, for an Application extension.
The registering process most importantly includes incorporating your extension's redux reducers, if provided, your translation bundle, if provided, and the extension service to expose, if provided.
When NG registers your extension, it automatically calls your extension's initFn and onPanelCreation methods. In your initFn or onPanelCreation method, you can handle all your extension's initializing process. Once the initFn method is called, you can start calling NG's API to communicate with it.
Extension unique ID
The Extension Unique ID serves a dual purpose for NG: it used by NG to identifiy and manage the loading process of extensions, while also establishing a connection with a server-side extension. This connection can link your extension to specific JMap projects, optionally allowing for the transmission of configuration data to your extension during project loading. The nature of your unique id thus depends on your way of deploying it.
How to deploy your extension
Once your extension is ready to deploy, you can compile it and host it on any CDN of your choice. If your extension is loaded via a project, the URL of your CDN will be configured in the server-side part of your extension. If you include your extension as a <script> tag in an HTML page, you will be able to use the CDN's url. In all cases, this url should always be accessible from the location where NG will run.
You can see a full extension example .
Display Feature Information
Some map features display an information tooltip when you click them.
The tooltip may contain attribute information such as text, hyperlinks (to open documents or videos in their native applications), photos, 360-degree photos, and more.
Sometimes, features from multiple overlapping layers have tooltips. In this case, when you click a feature, the tooltip displays the information for each overlapping feature. The content from the topmost layer is displayed first, followed by the content from the underlying layers. The order of the information in the tooltip reflects the drawing order of the layers.
If you have permission to edit the layer, the Edit icon provides access to the editing functions for which you have permission. Otherwise, this icon is not displayed. See the Edit Data section for more details.
Tooltips are not persistent and are displayed for one feature at a time.
To display a tooltip :
Click the feature for which you want to display the tooltip. The tooltip appears automatically.
Click a photo to enlarge it and display its subject and description.
Use the zoom controls
Displaying layers
You can select which layers to display on the map. For a layer to appear, you must first enable the display of the group and subgroups that contain it.
Enable the group : Toggle the switch on the group card from Off to On.
Note: If a group’s display is disabled, its layers will not appear, even if the subgroup display is enabled. Example: In the figure, the display of the ENVIRONMENT group is disabled. Even if the Ecological Interest subgroup is enabled, the group’s layers will not be displayed.
The Disabled Display icon appears when a layer’s display is turned off.Example: Road Network.
Enable the layer : Click the display icon to enable it. The icon disappears and the layer appears on the map.
Disable the display : Hover over the layer card and click the display icon .
Display Based on Scale
Some layers are configured to display only within a specific scale range. Displaying a very large number of small features at a small scale (zoomed out over a large territory) may reduce map readability.
Layers that are not displayed due to scale appear in a lighter color. When you change the scale, the color become darker, indicating that the layer is displayed (if its display is enabled).
Edit Table Data
You can modify non-spatial data displayed in tables if you have the required permissions.
Create a Record
To create a new record in a table:
Click the Add icon to open the form.
Enter values for each field in the form.
Some fields displayed as dropdown lists may include an empty option, allowing you to assign a null value.
If the form allows it, you can attach documents or URLs by clicking the Add button.
The maximum file size is 20 MB.
Once the form is complete, click Create to finalize the record. The new record appears in the table.
Modify a Record
To modify a record:
Hover over a record to display the Edit icon , then click it.
In the Update Record window, modify the desired field values.
If necessary:
Delete Records
To delete one or more records:
Select the records to delete.
Click the Delete icon . A confirmation message appears.
Export / Print a Map
You can export the map in various formats in order to print it or insert it into other documents.
Configuration tools are available in the Export / Print panel.
To open the Export / Print panel, click the Export / Print button .
The Export / Print Panel
The panel includes the following configuration options:
Title – Enter the map title. It is displayed in real time in the preview.
Subtitle – Enter the map subtitle. It is displayed in real time in the preview.
Paper Size – Select the paper size from the dropdown list. The layout updates in real time.
Scale – Enter a scale value. The map updates in real time. You can also adjust the scale directly in the map interface.
Orientation – Select the paper orientation from the dropdown list: Portrait or Landscape. The layout updates in real time.
File Type – Select the export format from the dropdown list: PNG, JPEG, or PDF.
Date – Select this option to display the date on the map.
North Arrow – Select this option to display the north arrow on the map.
Scale Bar – Select this option to display the scale bar on the map.
High Resolution – Select this option to export the file in high resolution.
The frame displayed in the center of the map interface represents the area that will be exported. It is fixed, and its dimensions vary depending on the selected paper size and orientation.
Export the Map
Configure the desired options in the Export / Print panel.
Move the map and adjust its scale so that the desired data appears within the export frame.
Click Download to export the map in the selected format.
The exported file name consists of the map title followed by the project name.
Tabular Data
Non-spatial data is displayed in table format, within the TABULAR DATA group of the Layers panel.
Opening a Table
In the Layers panel, click the table’s menu icon, then select Open Table. The table opens within the map interface.
Table Structure
Each row represents a record.
Each column represents a field (attribute).
Total rows indicates the number of records currently displayed.
Available Functions
Filtering Records : Use the toggle switches / to enable or disable filters. Only records that match the active filter criteria are displayed.
Editing (if permitted) : If you have the appropriate permissions, the editing icons and are enabled. See the section for more details.
Closing the Table
Click the Close icon to close the table and return to the map.
User Interface
The JMap Cloud Portal graphical interface includes the following components.
Jobs
This section displays the tasks that your organization runs on JMap Cloud. Its purpose is to provide information on problems that may appear when performing some functions.
A table displays a task in each row and the following attributes in columns:
Data Layers
Each layer card contains information such as the layer name and the configured styles.
To access the available tools, hover over the layer card.
Layer Components
Add a layer to display custom data from GeoJSON file
In this example, we will create a custom layer that fetches GeoJSON data from a file. It will display on top of all other layers.
The GeoJSON file for this example is located at this URL: .
Example
Try it out in
Name
Give the DS a name.
There are no restrictions for the name of resources (DS, projects, map layers) in JMap Cloud.
GetCapabilities URL
Enter the GetCapabilities URL which will return the capabilities of the WMS or WMTS server.
The URL must use the https:// protocol, otherwise an error message is displayed.
The URL should look like this:
For a WMS compatible server:
https://www.server.com/wms?SERVICE=WMS&VERSION=1.3.0&REQUEST=GetCapabilities
Optional.
You can add a description of the data source.
Tags
Optional.
You can add labels that can be used to sort or filter DS. You can create them by writing text in the box.
Tags are available for use with all resources (DS, projects, layers).
Status
Task execution status: Failed, Successful, Cancelled, etc.
Message
A very brief message describes the task performed.
Progress
The degree of completion of the task, in percentage.
Creation
Date the task was created.
Start
Start date of the task.
End
End date of the task.
Update
Task update date.
Members with the Administrator role view all of the organization's jobs in the table.
Members with the Editor role view only the jobs they have started.
A job can only be canceled by the member who started it.
Type
Indicates the type of task executed by JMap Cloud: Load, Analysis, Seed, etc.
Select a zoom levels range for which the layer is visible.
24 zoom levels are available. Level 0 corresponds to the entire planet (maximum zoom out), while level 23 corresponds to the closest zoom to a point on the map (maximum zoom in).
Restricting the visibility range of some layers improves application performance and map readability.
Rotation
Point features only.
Check this setting to rotate the layer's elements based on a quantitative attribute.
You must select the attribute and the rotation direction (clockwise or counterclockwise).
Generalization level
Vector data sources only.
Select a generalization level.
Generalization is the simplification and adaptation of the layer's content to make the map more readable and the application more efficient, with an acceptable loss of precision depending on the map's objectives.
Four options are available: None, Low, Medium, and High.
The default option is High.
Enable editing tools
Vector data sources only.
Check this setting to provide layer data editing tools to application users with the necessary permissions.
If this option is enabled, the layer data is automatically served as GeoJSON and is no longer cached.
Attributes
Vector data sources only.
This section displays the list of layer attributes.
The attributes are listed in alphabetical order.
Name, title, and type (double, integer, varchar, date) are displayed for each attribute.
When you check an attribute, it becomes visible to users and available for use in styles, labels, and popups. It is moved to the top of the list.
When you uncheck it, the attribute is no longer available for configuring styles, labels, or popups and returns to its original position in the list.
You can edit the title of each attribute:
Check the attribute you want to edit. The attribute is moved to the top of the list, and the Title field becomes editable.
Enter the title and accept the change.
Layer
WMS/WMTS services only.
Select the WMS/WMTS service layers that are used for the map layer.
Style
WMS/WMTS services only.
Select the layer style.
Image format
Raster data sources only.
Select the image format used for the layer.
2
Condition components:
Attribute : Select the attribute from the drop-down list. All attributes of the DS are available.
Operator : Select the operator from the drop-down list. Operators vary depending on the type of attribute selected (text, integer, double, date). The Filter operators section describes each of them.
Value : Enter the attribute value that will be used to filter the elements.
3
You can add a condition, update it by changing its components, or delete it.
New File: to upload a file from your local device.
Existing File: to select a file already stored on JMap Cloud. For more details, refer to the Uploading Files section.
If you choose New File, go to the corresponding tab and select the file to upload. Only one CSV file, compressed as a .zip, can be uploaded.
If you select Existing File, choose the desired file from those already available in JMap Cloud.
The fields in the file are presented in a table that contains the name and data type of each field.
Name
Give the DS a name.
There are no restrictions for the name of resources (DS, projects, map layers) in JMap Cloud.
Description
Optional.
You can add a description of the data source.
Unique identifier
Optional.
Select the field that contains the unique identifier of each table register. This identifier is necessary when you want to establish links with other data sources.
Tags
Optional.
You can add labels that can be used to sort or filter DS.
Tags are available for use with all resources (DS, projects, layers).
In this example, we will locate and select features on the map, for a given postal code.
In the example dataset, we will use the layer "Places", id=6. We will search on the postal code attribute (CODE_POSTA), and return all places having the given postal code.
Access documentation or log out via the menu icon .
to zoom in or out.
Click the Download icon to download the photo.
Click the Panoramic icon to display the photo in 360-degree mode.
Click the Full Screen icon to display the photo in full-screen mode.
Click the Exit Full Screen icon to return to the previous view.
Click the Close icon to close the photo.
Click the tooltip Close icon to close it, or click another map feature to open its tooltip.
Add documents by clicking the Add icon
Edit an existing document by clicking the Edit icon
Delete a document by clicking the Delete icon
Click Update to save the changes.
3
Documentation Access
Provides quick access to the JMap Cloud Portal documentation.
4
Section interface
Displays the content of the currently selected section.
Sections
Sections in JMap Cloud Portal generally display information in table format, and sometimes in card view, depending on the resource type.
Table View
In tables:
Each row corresponds to a resource (organization member, API key, file, task, spatial data source, etc.).
You can display 25, 50, or 100 rows per page.
If the number of rows exceeds the page limit, the table is paginated.
The footer displays the number of visible rows and the total number of rows.
Each column corresponds to a resource attribute, identified by its name in the header.
An options menu is available for each column when hovering over the column header. It allows you to:
Sort rows (ascending or descending)
Filter data by attribute value
Hide columns
Show hidden columns
Pin the column to the left or right side of the table
Access other section-specific functions
When a filter is applied, an icon appears next to the attribute name.
Card View
Some sections, such as Projects, offer a card view for a more visual representation. Cards display a summary of information associated with each resource.
A contextual menu is available:
In the Name column when hovering over a row in table view
Directly on the card in card view
Available actions vary depending on the resource and may include:
View information
Edit information
Create a source
Stop a task
Delete a resource
Other context-specific options
Some actions can be applied to multiple selected resources.
Adding Resources
Each section (except Tasks) includes a button for creating a new resource.
In the Data Sources and Projects sections, the Display button allows you to choose between:
Displaying all organization resources
Displaying only resources that belong to you
Date Format
All dates are displayed using the ISO 8601 format (for example: 2025-06-18T14:30:00Z).
Multilingual Interface
The JMap Cloud Portal interface supports multiple languages and can be displayed in French, English, or Spanish.
The language icon in the top bar, accessible from any portal section, allows you to select the interface language. When the language is changed, the portal returns to the Dashboard.
You can also translate the names of resources such as projects, layers, tables, attributes, and more. When the translation button appears in an interface or form, you can select a language and enter the corresponding name. These translations are displayed in both JMap Cloud Portal and JMap NG applications.
1
Header bar
Displays the current section of JMap Cloud Portal shown in the main interface.
Icons allow you to change the language and interface settings.
Information about the logged-in user is also available. Clicking the user avatar opens options to change the password, sign out, or switch to another organization.
2
Tools bar
Each icon provides access to a section:
Dashboard – Provides an overview of the organization’s resources you have access to.
Data Sources – Contains functions to create and manage spatial data sources.
Projects – Contains functions to create and manage projects.
– Allows you to create and manage data editing forms.
– Displays tasks executed by JMap Cloud Portal.
– Provides functions to manage administrative aspects of the organization, such as members and invitations.
Icons are enabled or disabled depending on the role of the logged-in user. See the section for details.
The toolbar can be expanded or collapsed using the arrow located at the bottom of the bar.
Layer icon : Displays the layer style (appearance of features). A number on the icon indicates that at least one style is configured. See the section for more details.
Ecological Interest
Layer name : Identifies the layer.
If metadata is configured, a tooltip displays it on hover.
Selection : Makes the layer features selectable for editing or interactive selection. See the section for more details.
Display : Enables or disables the display of the layer on the map. See the section for more details.
Menu : Depending on the data type, contains:
More information (see the section for details)
Styles (see the section for details)
Show layer extent (see
2
Available data sources
You can view the DS you have permission to access.
When you hover over the DS, icons indicating the data type are displayed.
3
Tool to define the initial extent of the project.
4
Layers
Icons indicate the functions available for the layer set.
List of map layers. When you hover over the layer, icons indicating the functions available for the layer are displayed.
5
Tabular non spatial data
Tabular date displays in this section.
6
Zoom
As you zoom in and out of the map, the zoom level is displayed here. The level ranges from 0, which shows the entire planet (the furthest you can zoom out), to 23, which shows a very detailed small area (the furthest you can zoom in).
7
The map instantly reflects the added data and their configurations.
Description of the dataset
You can modify it by clicking .
4
Check this box to enable editing tools
This will allow JMap NG application users with the appropriate permissions to edit the table data.
5
Table fields
You can view the contents of the fields by displaying the data source interface.
To view the information for a data source (DS), open the menu associated with the desired DS and select View Information. The interface consists of two tabs: Information and Attributes.
Information Tab
This tab displays general details about the data source:
Name and description
References: projects, layers, and/or tables using this data source
Associated tags
For spatial DS, an interactive map is displayed:
A dotted outline indicates the geographic extent of the DS
The base map is provided by OpenStreetMap
Digital Elevation Models (DEM) from GeoTIFF files are shown in grayscale
Additional technical information is also displayed:
DS identifier (click to copy to clipboard)
Unique identifier within JMap Cloud
Coordinate Reference System (CRS)
For tabular DS, a navigable data table is shown, along with:
The number of loaded rows
The total number of records in the table
Attributes Tab
This tab lists all attributes (or fields) of the DS. For each attribute, three sections are available:
Settings: title, data type, and indexing status for quick search
Statistics: value statistics (depending on the attribute type)
Value Domain: displays the current domain (if any), or allows you to create one
Value Domain
A value domain defines the valid set (finite or infinite) of values that an attribute can take—typically for text or numeric fields.
To create a value domain:
Click Create Value Domain.The Value and Label columns appear.
All values present in the data are automatically added.
Click + to add a row.
Enter the value and its label.
You can:
Remove a value that is not present in the data by clicking the icon
Delete the entire domain by clicking Delete Value Domain
Editing Parameter Values
You can modify some parameters:
If you have edit permissions for the DS, when you hover over the Description, Labels, and Unique identifier (SDS) parameters, the icon appears, allowing you to edit the parameter.
Also, if you have edit permissions, you can edit attribute/field titles, index them (by checking the box Indexed), and create, modify, or delete a value domain for text or quantitative attributes.
Press or to save or discard changes.
Only indexed attributes can be used in simple searches (searching for elements in a project's layers based on attribute values) in the NG application.
Editing Parameters
If you have editing permissions on the DS, you can modify certain parameters directly in the interface:
Hovering over the Description, Tags, or Unique Identifier (for spatial DS) displays the icon, allowing you to make edits
You can also:
Edit attribute titles
Click to save or to cancel your changes.
Only indexed attributes can be used in simple searches within the JMap NG mapping application (i.e., searching for features in layers based on attribute values).
Creating a New Project
You can create a new project from the Dashboard or from the Projects section of the portal.
To create a project:
Click Create a new project.
Fill in the required project settings (name, description, etc.).
Once created, the project will appear in the Projects section.
In both card and list views, an options menu is available for each project. It allows you to (edit, duplicate, delete, etc.).
Project settings
Permissions
You can grant permissions to other members, groups, or API keys from JMap Cloud for the projects you own.
There are three levels of permissions, based on user roles. These permissions are hierarchical: the highest level automatically includes the other two.
Owner
As the project owner you can grant this permission to a member of the organization who has at least the role.
This permission, the broadest, allows the user to:
manage accessibility to the project, that is to say make it public or private,
grant access permissions to members of the organization,
Modify
You can grant this permission to an organization member who has at least the role.
This permission allows the user to:
modify the project settings with the exception of its accessibility.
Granting Permissions
To grant permissions for a project:
Click , then select Permissions. The permissions configuration interface opens, showing each member and their associated permissions. A letter indicates each member’s role.
To add a new member, open the dropdown in the Add a member section.
Select the relevant members, groups, or API keys. You can clear the selection by clicking .
The Ownership permission automatically includes both Edit and Read.
Groups cannot be granted the Ownership permission.
Modifying Permissions
You can modify existing permissions, grant access to new members, or remove all permissions from one or more members.
Each project must always have at least one member with Ownership permission.
Click , then select Permissions to open the configuration interface.
Modify permissions by checking or unchecking the appropriate boxes.
To remove all permissions from a member, uncheck all three boxes. If you uncheck Ownership, the Edit permission will automatically become the highest one assigned.
Vector Tile Cache
Vector tiles are a highly efficient format for web mapping. The core concept is to divide a project's vector data into tiles, similarly to raster tile systems (e.g., WMTS).
There are several standards for producing vector tiles. Mapbox introduced a format based on Google’s Protocol Buffers encoding ( https://developers.google.com/protocol-buffers). Known as MVT (Mapbox Vector Tiles), this format is widely supported by mapping tools including JMap Cloud, JMap Server, and JMap NG.
A tiling grid is applied to vector data, dividing it into tiles. Each tile can include features from multiple layers. A full set of tiles is generated for each zoom level. In web mapping, there are typically 23 levels:
Level 0 represents the entire Earth
Level 23 corresponds to street-level detail
Lower zoom levels use simplified geometry to reduce file size and improve performance.
Vector features (lines, polygons) are clipped at tile boundaries. When a geometry spans multiple tiles, it is split, and each tile stores only its part. The mapping application is responsible for reconstructing the complete geometry.
Feature attributes are embedded in the tiles, allowing dynamic and interactive data usage—for example:
generating thematic maps on-the-fly
applying attribute-based filters
Styles are not included within the tiles. Instead, they are defined in a separate JSON file. This allows applications to dynamically style data, eliminating the need to regenerate tiles when styles change.
Vector tiles can be generated on-the-fly or pre-generated and cached, significantly improving server response times and ensuring smooth user experiences.
Vector Tile Generation in JMap Cloud
A JMap Cloud project produces three types of data consumed by client applications:
Style JSON File
This file accompanies the vector tiles and contains layer definitions, styles, thematics, etc.
Vector Tile Set (MVT)
These tiles contain the geometry and attributes of non-editable layers.
They can be generated:
on demand, as users navigate in JMap NG
Performance Factors for Vector Tiles
While vector tiles are generally lighter than raster tiles, several factors can affect tile size and impact JMap NG application performance:
Number of attributes per layer
More attributes increase tile size and load times.
Layer visibility scales
For dense layers, it is recommended to limit their visibility to higher zoom levels. This reduces data volume in low zoom tiles and accelerates tile generation.
Caching
Pre-generating and caching tiles greatly enhances performance.
Managing a Project’s MVT Cache
Cache generation can take considerable time and storage space. It is not recommended to cache tiles beyond level 19.
To manage a project’s vector tile (MVT) cache:
Click , then select MVT Cache to open the management interface.
This interface includes four sections.
Form Components
Form components are typically associated with an attribute or field from the data source, except for the Label component, which is not data-bound.
The following sections describe:
the types of components available in JMap Cloud Portal,
the parameters specific to each component type,
and the various features for managing components within a form.
Component Types
JMap Cloud Portal offers a variety of component types to meet different functional and visual requirements within forms.
Component Parameters
Each component type includes specific parameters that control its behavior and appearance (e.g., default text, formatting, style, constraints, etc.).
Working with Components
Adding a Component
To add a component to a form, drag it from the palette and drop it into the Design tab interface. Components can be placed within .
By default, components are stacked vertically within the form.
Configuring a Component
To configure a component already placed in the form, click on it in the Design tab. Its editable parameters will appear in the Properties section.
You can adjust the spatial arrangement of components using the layout tools described in the following section.
Deleting a Component
To delete a component, click on it in the Design tab, then click the delete icon .
The Layers Panel
The Layers panel lets you configure the map displayed in the application. It contains:
Details of the project layers with tools to control display and selection
Base maps
Tabular data
Using the Layers Panel
Select Map Data
Click the Layers icon to open the panel. Layer groups are displayed as cards. Each group can be open (displaying subgroups and layers) or closed (displaying only the name).
In a group card, click to open it and display the subgroups and layers it contains. Subgroups are indicated by the Subgroup icon , while each layer has its distinctive icon.
Click the Group icon to open a subgroup and display its layers. The icon changes to
Access Tabular Data
In the TABULAR DATA group, click the menu icon, then select Open Table to display the table in the interface.
Select a Base Map
Select a base map in the BASE MAP group. The name of the selected map is displayed with the group name.
Base map attributions are displayed at the bottom of the map.
Filter Layers
To quickly find the groups, layers, and tables you're interested in, you can filter the panel content.
Click the Filter icon to open the Layer filters function.
Enter text in the Layer name field to filter groups, layers, and tables. The panel displays only those whose names contain your search terms.
Click the Execute icon
Create and Manage Custom Maps
You can create custom maps in JMap NG to save them and share them with other users or external applications.
A custom map reproduces a specific map environment, including layers, styles, scale, measurements, annotations, and selected features.
All operations related to custom maps are performed from the My Maps panel.
To open it, click the My Maps button .
The My Maps Panel
The panel includes the following elements:
Add Map – Create a new custom map (see the section).
Filter – Filter maps by entering keywords (searches in the title and description).
Sort By – Sort maps by creation date or title. Select an option from the dropdown list, then choose ascending or descending order.
You can also edit a map’s title and description directly from its card:
Click the title or description to activate editing.
Make the desired changes.
Click the Save icon to apply the changes or the Discard icon to discard them.
To display a map, click its card in the My Maps panel.
Create a Custom Map
To create a new custom map:
Open the My Maps panel.
Click Add to open the creation interface.
Enter a title in the Title field (required).
Share a Custom Map
To share a custom map:
Open the My Maps panel.
In the desired map card, click the Share icon to open the sharing options.
Two options are available:
Share Map – Generates a URL for the custom map. The icon indicates that sharing is enabled.
Share Map and Copy Link – Generates the URL and automatically copies it to the clipboard. A confirmation message appears. The icon indicates that sharing is enabled.
You can send this link to other users who, depending on their access rights, can open a JMap NG application displaying your custom map (including its measurements, annotations, and selected features).
Disable Sharing
To disable sharing:
Click the Share icon to display the sharing options:
Stop Sharing – The link will no longer be active.
Copy Share Link – Copies the existing share link to the clipboard.
Once sharing is disabled, users who still have the link can access the standard project interface in JMap NG, but they will receive an error message indicating that sharing of the custom map has been disabled.
Start the JMap NG Core library
You can start JMap NG Core in a div of your website, or as a full page application.
Import the library from CDN
To use the JMap NG Core library, simply import the JMap NG Core Javascript library from our CDN link.
Make sure the version of the library matches the version of your JMap Server instance.
Set library options
You have to specify options to the library:
More information about startup options
Display the map in a div
Try it out in
Display the map full page
Instead of running JMap NG Core inside a DIV, you can start it directly in the body of the web page for a full page experience.
Try it out in
Uploading Files
You can upload files to JMap Cloud to use them later when creating data sources. The Files tab, located in the Data Sources section, provides tools to upload and manage your files.
The content of uploaded files is stored in JMap Cloud’s databases. However, files listed in the Files table are automatically deleted after 10 days.
Files Tab
This tab displays a table of all the files you’ve uploaded. A button is available to let you upload new files.
Vector/Raster Data Files
JMap Cloud allows you to create spatial data sources (SDS) from various vector and raster file formats: CSV, KML, DXF, DWG, SHP, TAB, GeoPackage, FileGeoDatabase, GeoJSON, and GeoTIFF.
Creating a Spatial Data Source from Files
Creating an SDS is done in several stages:
1. Selecting the file
Labels
Labels are texts associated with map features. They are used to display information about features directly on the map. For example, you can use labels to show city names from a point layer representing urban areas.
The Labels section, accessible via the , allows you to configure the content, style, and display settings of labels for the layer's features.
Navigating the Map
JMap NG offers several ways to navigate the map and explore your data:
Search for a specific location
Search for features in the project (simple search)
Measure Distances and Areas
The tools available in the Measurements panel allow you to measure distances and areas (area and perimeter) on the map.
The Measurements panel contains all measurement tools available in the application.
To open the panel, click the Measurements button . The icon changes color .
Start the JMap NG App
You can start JMap NG App in a div of your website, or as a full page application.
Import library and application from CDN
You must import App js files from our CDN links (it will automatically load the JMap Core dependency).
Make sure the version of the library matches the version of your JMap backend (JMap Cloud or JMap Server).
Create, modify, or delete value domains (for text or numeric attributes)
Map unit
Select the map unit.
The mapping unit is automatically selected based on the selected CRS.
Display unit
Select the unit used to display map coordinates.
Measurement CRS
Select the coordinate reference system that will be used for calculating measurements.
The default CRS is EPSG:4326 - WGS 84, latitude/longitude coordinate system used by global positioning systems (GPS). Distance and area measurements are made using spherical calculations based on the ellipsoid of the projection.
Measurement unit
Unit used to display measurements (distance, area, etc.).
Background color
Default background color of the map.
Selection color
Color of selected objects on the map.
This parameter can also be defined for each layer.
Initial rotation
If you want to print a rotation to the map, enter the rotation value in degrees. The rotation is clockwise.
Description
Optional.
Enter a description for the new project. This is useful for project management purposes.
Extensions
Optional.
This section lists the extensions available for the project.
Check the extension you want to add to your project.
Tags
Optional.
Add tags that can be used to sort or filter projects.
You can create them by writing the text in the range. Once created, they are available for use in all resources (DS, projects, layers). They appear when you enter label terms.
Name
Enter a name for your new project.
As with other JMap Cloud resources, the name does not need to be unique.
Press the English button if you want to give the project name in another language (French or Spanish).
Default language
Among the available languages, select the one that will be used by default when the requested language is not available or translations are missing.
Public
Optional.
Check this setting if you want to make the project public. If you do not check the box, the project is private. The Permissions section describes the details of project access.
You must first complete the project creation procedure to then be able to make it public.
When the box is checked, the icon is displayed to copy the URL of the JMap Cloud application that opens the project.
Map CRS
Select the map reference coordinate system.
It determines how data is displayed in map applications.
All data using a different projection is converted on the fly to that projection.
The default CRS in JMap Cloud is EPSG:3857 - WGS 84 / Pseudo-Mercator, the most common for web mapping applications.
GeoJSON Vector Data
These represent the editable layers and are delivered on demand, by region.
This option allows you to specify whether you want to remove tiles from all 23 levels or from a specific range of levels. In this case, indicate the minimum and maximum levels of the range.
Running task
Indicates the progress of the creation or deletion by cache level as well as the overall progress of the creation or deletion.
Choose the task you want to perform.
Click Launch task. The Running task section shows progress visually and as a percentage.
To cancel a running task, click . A confirmation message will appear.
Cache state
Indicates the cache status, if available.
Fill
This option allows you to indicate whether you want to create tiles for all 23 levels or for a specific range of levels. In this case, specify the minimum and maximum levels of the range.
This option does not overwrite tiles that are already cached.
Delete
List
List of values from which, depending on the configured setting, only one value (single choice) or multiple values (multiple choice) can be selected.
The associated attribute or field must be alphanumeric or numeric and must have a n that details the possible values that the attribute or field can take.
Value domain
List component.
This section allows you to view the attribute's value domain. If you want to edit the values, click Show value domain to open the interface. You can then edit the values.
If the attribute does not have a value domain, the Create value domain button appears, and when you click it, the tab interface appears, allowing you to create the value domain.
Minimum
Number component.
Enter the minimum value for the attribute.
Maximum
Number component.
Enter the maximum value for the attribute.
Checked value
Boolean component.
Specify the value to save when the box is checked or the switch is enabled.
Unchecked value
Boolean component.
Specify the value to save when the box is unchecked or the switch is disabled.
Status - Required
Determines whether the field is required.
The user will not be able to submit the form until all required fields are completed.
Required fields are marked with an asterisk (*) in the form designer.
Status - Read only
Enable this option to make the component read-only.
The user will not be able to edit the content.
This option should be used for a component with a default value.
Label
Static text to be displayed as is in the form.
Text
Input field for an alphanumeric value.
The associated attribute or field must be of type Text.
Number
Input field for a numeric value.
The associated attribute or field must be of type Number.
Boolean
Allows you to fill in the attribute or associated field for which there are only 2 possible values, true and false.
Date
Attribute
Select the layer attribute or table field that the component is associated with. This is the attribute or field that the form component will populate.
Title
Give the component a title.
Default value
Enter or select a default value to initialize the input field.
Choice
List component.
Select the list type: single choice or multiple choice.
Allows you to select a date.
The attribute or field must be of type Date.
Select the display type for the component in the form.
Text: Single line or Multiple line.
List: Radio button or Selection.
Boolean: Checkbox or Switch.
Number: Input field or Slider.
, indicating that the subgroup is expanded.
Click the Subgroup icon to close the subgroup.
Click the Collapse icon to close the layer group.
Hover over a layer to display the available tools. (See the Data Layers section for more details on these tools.)
to apply the filter to the map. Only the filtered groups and layers whose display is enabled appear on the map.
Click the Filter icon to remove the filter. All groups, layers, and tables reappear in the panel. You must manually enable the display of features to view them on the map.
Map Cards – Each custom map is displayed as a card showing its title, description, and the following tools:
Update Map – Updates the custom map so it reflects the most recent version of the data.
Share Map – Opens the sharing options (see the Share a Custom Map section).
Delete Map – Deletes the custom map.
Optionally, enter a description in the Description field.
Click Save. The new map card appears in the My Maps panel.
Click Stop Sharing. The icon indicates that sharing is disabled.
You can select one or more files in the table using the checkboxes. When selected, the Delete option becomes available, allowing you to delete multiple files at once.
Uploading a New File
Since spatial vector datasets typically consist of multiple files, you must compress them into a single .zip archive before uploading. Non-spatial tabular data files must also be uploaded as compressed .zip archives.
Compression is not required for raster files, unless you are uploading multiple files to be used as a mosaic—then, they must be grouped into a single .zip archive.
Upload Methods:
Drag and drop one or more files directly into the table. The upload will start automatically.
Or click Upload a file to open the file browser and select your files. Uploading will start automatically.
Up to three files can be uploaded simultaneously.
Uploaded files will appear in the table along with a progress indicator.
Status of a File
The status of each file indicates which step of the process was completed by JMap Cloud.
Waiting
The file is waiting to be uploaded.
Processing
The file is being analyzed.
Analyzed
The file has been analyzed by JMap Cloud which identifies properties such as file type, CRS, attributes, etc.
It is available to create a spatial data source.
Uploading
The file is being uploaded.
A line in the Status column indicates the progress of the upload.
A circle in the header bar indicates the progress of the upload as well as the number of files being uploaded.
A message indicates whether the upload was successful or failed.
Managing a File
As with other JMap Cloud resources, you can manage a file by clicking the icon that appears when hovering over the row. Available actions depend on the file’s status:
Create Data Source
Delete
Cancel Upload
View Info
Creating a Data Source
If the file’s status is Analyzed, the Create source option becomes available. Click it to open the data source creation interface.
Enter the necessary details based on the file type. For more information, refer to the sections:
Click Create to generate the data source. It will then appear in the Data Sources tab.
Pausing Upload
This option is available when the file is still uploading or being analyzed. It lets you stop the process.
Displaying Information
Click Display informations to see the following details:
File name, size, format, and status
The ID of the user who uploaded it
Upload date and time
Metadata, which includes:
Unique file, organization, and task identifiers
Data layer names
Attribute names and types
Deleting a File
Click Delete. A confirmation prompt will appear.
Deleting the file does not remove any data source that may have been created from it. Only the file itself is deleted from the table.
Go to the Data Sources tab and click Create a data source.
Select Vector/Raster data file.
Choose between:
New File: to upload a file from your device.
Existing File: to select a file already uploaded to JMap Cloud. See Uploading Files for more information.
For vector datasets, you must combine all associated files into a single .zip file before uploading.
For raster datasets, compression is not required unless you are uploading multiple files to create a mosaic—in which case they must also be combined into a .zip archive.
2. Analysing the file
If uploading a new file, JMap Cloud automatically analyzes the file’s metadata (format, type, coordinate system, geographic extent, etc.) before displaying the configuration window.
In the case of raster data files, automatic processing is carried out at this stage:
Conversion to the optimized COG (Cloud Optimized GeoTIFF) format
Creation of a multi-resolution image pyramid for efficient display
If selecting an existing file, the analysis (and conversion, in the case of raster files) has already been completed, and the configuration window is shown immediately.
3. Configuring SDS Parameters
The configuration parameters vary depending on the data type and format. See the File Settings section for detailed information.
You can also add a description and tags to help filter and organize your data sources. To create new tags, simply enter text in the Tags field.
4. Finalizing the SDS creation
Click Create to finalize the SDS. It will appear in the data source table. Its status will show as In Preparation during processing, then Ready once the creation is complete.
Once a data source is created for a file, the file is no longer required as the data is transferred to the JMap Cloud databases. All uploaded files are automatically deleted after 10 days.
File Settings
The table shows the general settings to configure when creating a DS from vector/raster data files.
Name
Give the DS a name.
There are no restrictions for the name of resources (DS, projects, map layers) in JMap Cloud.
Layer
Vector data only.
This setting is specific to files that contain multiple data layers (GML, DWG, GeoJSON, etc.).
Select the layer from which you are creating the SDS.
CRS
If JMap Cloud has correctly identified the CRS, this field cannot be modified.
Otherwise, select the data projection system.
X
Vector data only.
This setting is specific to CSV format files. Select the field (numeric values) that contains the longitude coordinates.
Only indexed attributes can be used in simple searches (searching for features in layers of a project based on attribute values) of JMap NG application.
3
Area for writing the label content.
The section provides details on this topic.
4
Attributes
Available attributes for labels.
These are the layer attributes that you select in the section.
5
Functions
Functions available for labels.
The section details these functions.
6
Zoom levels
Zoom levels range at which labels are displayed.
Define the range by dragging the indicators on the bar or by entering the minimum and maximum zoom values for the range.
7
Position
Determine the position of the label relative to the element.
Click to select the position from the nine possible options.
Allow overlapping
Check the box to allow the labels of the layer to overlap the labels of other layers. This option can be useful to ensure that all labels of this layer are displayed.
Follow the line
Only for line elements. Check the box to display the label text along the lines.
Spacing (pixels)
Only for line elements. Specify the spacing (in pixels) between repeated labels on the same line.
8
Offset (pixel)
Set the offset in pixels and on both dimensions of the label's position relative to the element.
9
Frame
Check the box to add a frame to the label text.
Select the background and countour color for the frame.
10
Rotation
If you check Rotation using an attribute, select the numeric attribute whose values will be used as the rotation angle and the rotation direction. Only for line elements.
If you check Follow map rotation, labels will follow the map rotation.
11
Proportional size
By default, label text is always displayed at the specified font size, independently of the zoom level of the map.
Check this option to have the label text size adjusted proportionally to the zoom level of the map.
Drag the point in the bar to select the reference zoom level at which text is displayed at the specified font size.
When the zoom level of the map changes, the text size is modified accordingly.
12
Click on the language of your choice to enter the label content in the selected language.
Label Content
Labeling is done by defining the text that will appear as the label. This text can span multiple lines and contain:
static content (unchanging),
dynamic functions (variables), which are automatically replaced with their results when displayed.
The available functions are:
ev(attrib)
attrib : the name of an attribute
This function is replaced by the value of the bound attribute whose name is passed as a parameter for the pointed element.
Exampleev(id)
Label displays the value of the id attribute for this element.
ifNull(attrib, value)
attrib : the name of the attribute to test
value : the value to display if attrib is null
This function is replaced by the value value only if the value of the attrib attribute is null.
If the attribute value is not null, nothing is displayed.
ExampleifNull(temp, N/A)
Displays N/A if the value of the temp attribute is null.
ExampleifNull(attrib_a, attrib_b)
Displays the value of the attrib_b attribute if the value of the attrib_aattribute is null.
ifNotNull(attrib, value)
attrib : the name of the attribute to test
value : the value to display if attrib is not null
This function is replaced by the value value only if the value of the attrib attribute is not null.
If the attribute value is null, nothing is displayed.
ExampleifNotNull(land_value, $)
Displays $ only if the value of land_value is not null.
The usable attributes are shown in the Attributes section.
To configure label content:
Enter the desired static text.
To insert dynamic content, place the cursor at the appropriate position in the text area.
Click the function you want to use. It will be added instantly, and a menu will appear showing the available attributes for that function.
Select the attribute and enter a value if needed.
Click to save the label content.
1
Activate labels
Check this box to display labels by default in JMap NG.
2
Font
Click this button to select the label text style: font, font size, bold, italic, font color, outline, and outline color.
Navigate with your fingers or mouse
Centre the map on precise coordinates and adjust the scale
Search for a Location
You can search for a specific location to centre the map on it:
Click the Location icon to open the search field.
Enter the location information (address, postal code, city, place name, etc.). JMap NG uses the Mapbox Geocoding service to find the location. Matching results are displayed as you type.
Select the desired location by clicking it in the list. The map automatically centres on that location, identified by a marker , and zooms in to show more details. A tooltip displays the location information.
Note: When you search for a new location, the marker for the previous location disappears.
Click the Close icon to clear the search terms.
Click the Location icon to close the search and remove the last displayed location information.
Search for Features in the Project (Simple Search)
You can search for features across the project layers based on their attribute values.
The attributes used for simple searches must be indexed in the data source and selected in the project layer. Contact your JMap Cloud administrator if you would like specific attributes to be available for simple searches.
Click the Search icon or press the / key to open the Search in project field.
Enter your search terms. As you type, a list displays all features in the project whose attributes match your terms, across all layers.
Click a feature in the list to locate it. The feature is selected and the map centres on it.
Click the name of a layer to select all features in that layer matching your search. The map centres to display all of these features.
Navigate with Your Fingers or Mouse
You can explore the map interactively:
With Your Fingers (touch device)
Pinch/spread: Zoom out/in
Drag: Pan the map
Two-finger rotation: Rotate the map
Two-finger swipe up/down: Tilt the map (3D navigation)
With Your Mouse
Scroll wheel: Zoom in/out
Left click + drag: Pan the map
Ctrl + click + drag: Rotate and tilt the map
Control Orientation
Click the Orientation icon to display information about the rotation (in degrees relative to North) and the tilt (in degrees relative to the horizontal plane).
Click the Orientation icon to restore the default orientation (flat view oriented North). The icon turns grey and indicates North on the horizontal plane.
Center the Map on Coordinates and Modify the Scale
You can center the map on a precise coordinate and change the map scale:
Modify the Scale
Click the Geographic Information icon to open the geographic information window.
Click Scale to open the Change the map scale window.
Enter a new scale or adjust it using the arrows. The map scale updates in real time.
Click OK to close the window and apply the chosen scale.
Change the Coordinate System
Click EPSG:4326 or EPSG:3857 to switch between coordinate reference systems:
EPSG:4326: Coordinates in Latitude and Longitude (Lat, Lon)
EPSG:3857: Coordinates in X and Y (meters) in the Web Mercator projection
The displayed coordinates correspond to the current cursor position and update as you move it.
Center on Precise Coordinates
Click the displayed coordinates to open the Recenter the map window.
Enter the desired coordinates or adjust them with the arrows. The map recenters automatically and a point marks the exact position.
Click OK to close the window. You can click the Back icon to return to the previous view.
Using the Measurements Panel
Select a measurement tool by clicking its icon. See the Measurement Tools section for details.
Select the Snap option if needed. See the Snap Tool section for details.
Choose the layer to which measurements will snap.
Perform measurements. You can use multiple tools; measurements accumulate on the map, and the measured distances and/or areas are displayed in the corresponding tool card. The total number of measurements appears in the panel.
Additional controls allow you to:
View the number of measurements performed
Select measurements to edit or delete them
Delete all measurements
Access measurement help
Measurement Tools
Distance
This tool allows you to measure distances. The unit of measurement is defined in the User Settings.
Click the Distance tool to activate it. Instructions appear in the help area at the bottom of the map.
Click once the map to start measuring.
Click the map to define the vertices of the line.
Double-click or press the Spacebar to complete the measurement. The length of each segment and the total line length are displayed on the map. The total distance also appears in the Distance card.
Repeat as needed. The lines remain displayed on the map, and the cumulative total distance appears in the Distance card.
Click the Delete button in the Distance card to remove the lines.
Area
This tool allows you to measure areas by drawing polygons. The unit of measurement is defined in the User Settings.
Click the Area tool to activate it.
Click once the map to start measuring.
Click to define the vertices of the polygon.
Double-click or press the Spacebar to complete the measurement. The length of each segment, the perimeter, and the area are displayed on the map. The area also appears in the Area card.
Repeat as needed. The polygons remain displayed on the map, and the cumulative total area appears in the Area card.
Click the Delete button in the Area card to remove the measurements.
Circular Area
This tool allows you to measure circular areas by drawing circles on the map. The unit of measurement is defined in the User Settings.
Click the Circular Area tool to activate it.
Click once the map to define the center of the circle.
Drag to set the radius.
Click the map or press the Spacebar to complete the measurement. The radius, circumference, and area are displayed on the map. The area also appears in the Circular Area card.
Repeat as needed. The circles remain displayed on the map, and the cumulative total area appears in the Circular Area card.
Click the Delete button in the Circular Area card to remove the circles.
Snap Tool
The Snap function allows the pointer to snap to features (points, vertices, or line segments) of the selected layer, resulting in more precise measurements.
To use the Snap tool:
Enable the Snap option.
Select the layer to which measurement vertices should snap.
When the pointer approaches a point, vertex, or line segment of the selected layer, it automatically snaps to that feature. Click to define the vertex of your measurement.
Modify Measurements
You can modify the shape or location of measurements, or delete them.
You can modify one measurement shape at a time. You can move or delete multiple measurements at once.
Modify the Shape of a Measurement
Click Select to enable selection mode.
Double-click the measurement to modify. Its vertices appear.
Click a vertex to select it (it becomes highlighted).
Drag and drop the vertex to change the shape.
Click the map to complete the modification.
Move Measurements
Click Select to enable selection mode.
Click a measurement to select it. Its vertices appear.
Hold the SHIFT key and click additional measurements to add them to the selection.
Drag and drop the selected measurements to the desired location.
Click the map to deselect the measurements.
Delete Measurements
Click Select to enable selection mode.
Click a measurement to select it.
Hold the SHIFT key and click additional measurements to add them to the selection.
Click Delete. The button displays the number of selected measurements in parentheses. The selected measurements are removed.
Permissions
As the owner of a data source (DS), you can grant access permissions to other users within your organization.
Viewer role-based permissions are at the base of the hierarchy and always include View.
Steps to grant permissions:
Click the icon next to a DS, then select Permissions.
The permissions management interface will open, displaying:
the name of the DS;
the list of members, groups, and API keys with their current permissions.
Groups cannot be assigned the Owner permission.
Modifying or Removing Permissions
You can at any time:
change existing permissions;
add new users;
remove all permissions from one or more members, groups, or API keys.
Steps to manage permissions:
Click , then select Permissions to open the configuration interface.
Check or uncheck the relevant boxes to update permissions.
A DS must always have at least one user with Owner permission.
To remove all permissions:
Start by unchecking the highest-level permission (e.g., Owner). The next level (e.g., Edit) becomes the highest active permission.
For Viewer-type permissions, you must first uncheck the specific sub-permissions before removing the general View right.
To delete members, groups, or API keys from the permissions list:
Check the box next to each name;
Click the icon to remove them from the list.
Popups
Popups are used to display contextual information about hovered map features. This information may include text, attribute values, hyperlinks, images, and more.
You can configure the specific data shown in popups for each layer.
The Popups section, accessible via the icon, allows you to define both the content and display settings of popups.
Y
Vector data only.
This setting is specific to CSV format files. Select the field (numeric values) that contains the latitude coordinates.
Unique identifier
Optional.
Vector data only.
Select the field that contains the unique identifier of each map element. This identifier is necessary when you want to establish links with other data sources.
Attributes
Vector data only.
File attributes are presented in a table that contains the attribute name and type as well as a box to check which attributes should be indexed for quick search.
Description
Optional.
You can add a description of the data source.
Tags
Optional.
You can add labels that can be used to sort or filter SDS.
Tags are available for use with all resources (DS, projects, layers).
The file has been uploaded. It needs to be analyzed to be available for creating a spatial data source.
Error
There is an error in the file loading process.
Viewer
Create Features (Spatial DS)
This permission allows the user to create features in the SDS in a cartographic application (such as JMap NG).
Insert Data (Non spatial DS)
This permission allows the user to insert data to the DS in a cartographic application (such as JMap NG).
Viewer
Edit Geometries (Spatial DS)
This permission allows the user to edit the geometry of SDS features in a cartographic application (such as JMap NG)
Viewer
Edit Attributes (Spatial DS)
This permission allows the user to edit the attributes of SDS features in a cartographic application (such as JMap NG).
Update data(Non spatial DS)
This permission allows the user to modify the values of DS fields in a cartographic application (such as JMap NG).
Viewer
Delete Features (Spatial DS)
This permission allows the user to delete features from the SDS in a cartographic application (such as JMap NG).
Delete data(Non spatial DS)
This permission allows the user to delete data from the DS in a cartographic application (such as JMap NG).
To add a new user:
Open the dropdown list in the Add a member field;
Select a member, group, or API key (one at a time).
The selected name appears with a letter indicating their role.
You can clear a selection using the ✕ icon if needed.
Click to include the user in the permissions list.
Check the boxes to assign the appropriate permissions to each user.
Editor
Owner
This permission, the broadest, allows the user to:
grant access permissions to members of the organization,
delete the DS.
The SDS must have at least one owner.
Editor
Modify
This permission allows the user to modify the DS settings.
Viewer
View
For the user with the VIEWER role, this permission, combined with the Extract Features permission, allows the user to view SDS data in a cartographic application (such as JMap NG).
For a user with the EDITOR role, this permission allows the use to view the DS in JMap Cloud Portal and use it in projects.
Viewer
Extract Features (Spatial DS)
This permission allows the user to extract features from the SDS and, combined with the View permission, allows to view SDS features in a cartographic application (such as JMap NG).
Extract Data (Non spatial DS)
This permission allows the user to extract data from the DS and, combined with the View permission, allows to view DS data in a cartographic application (such as JMap NG).
Area for entering the popup content.
The section provides details on this topic.
3
Available attributes for the popup.
These are the layer attributes that you select in the section.
4
Available popup functions.
The section provides details on this topic.
5
Zoom levels.
Zoom levels range at which labels are displayed.
Define the range by dragging the indicators on the bar or by entering the minimum and maximum zoom values for the range.
Popup content
Popup content is defined using a text field that can combine static text with dynamic components called functions. When the popup is displayed, these functions are executed and replaced with their results.
Here are the functions available for popup configuration:
centroid()
Replaced by the coordinates of the geometric centroid of the element's geometry.
date()
Replaced by the current date.
elementId()
Replaced by the element identifier.
encode(attrib, encoding)
attrib : the name of the attribute to encode
encoding : the name of the encoding
Replaced by the value of the attrib attribute once it is encoded with the specified character encoding (UTF-8, CP437, ISO 8859-1, etc).
Exampleencode(name, UTF-8)
Replaced by the value of the name attribute encoded in UTF-8 characters.
ev(attrib)
attrib : the name of an attribute
The attributes available for use in functions are shown in the Attributes section.
To configure popup content:
Enter the static text.
To insert dynamic content, place the cursor at the desired location in the text field.
Click the function you want to use. It will be inserted automatically, and a menu of compatible attributes will appear.
Select an attribute and add a value if applicable.
Click to save the tooltip content.
1
Check this box to enable the display of popups for the layer in JMap NG applications.
2
User Interface
The JMap NG interface consists of three main elements:
A sidebar with icons to access the different features
Navigation and geographic positioning tools
The map displaying the project data
Sidebar: Icons and Functions
Icon
Function
Details
Each panel contains functions and information specific to its theme.
Map Navigation Tools
Icon
Function
Details
Base Maps
Base map attributions are displayed at the bottom of the map.
Edit Layer Data
You can create, modify, or delete features in vector layers.
You must have specific permissions for each type of editing operation in order for the corresponding functions to be enabled.
Create a Feature
To create a new feature:
Click the Create a new feature button in the map interface. The Select the feature type to create panel opens, and the corresponding icon appears in the sidebar.
This panel lists all layers for which you have permission to create a feature.
Click the desired layer to select it, then click Next to open the Create Geometry panel.
Create the feature geometry according to its type. You can enable the tool and select the layer to which newly created features will snap.
Click Next to open the feature attribute form and, if permitted, attach documents. See the section for details.
Click Create to finalize the feature. The feature appears on the map, and the Select the feature type to create panel closes automatically.
Form
The data entry and editing form for a layer may include several components:
Layer Attributes (1) – Fields used to describe the feature
Subform (2) – Table containing records associated with the feature
Attachments (3) – Section used to associate documents with the feature
Layer Attributes
Attributes may be:
Required (*) – The form cannot be saved without a value.
Read-only – These attributes cannot be modified.
Accepted value types include:
Alphanumeric (text or number)
Date
Boolean (true/false)
Input methods may vary:
Text or numeric fields
Single- or multi-select dropdown lists
Checkboxes or toggle switches
Subform
A layer may have non-spatial tabular data associated with its features.
For example, a point layer representing air quality monitoring stations may be associated with a table containing pollutant concentration records measured on different dates.
The subform allows you to add, modify, or delete records in the associated table. When creating a feature, you can complete the subform immediately or later when . If you have the required permissions, the subform icons are enabled.
Add a record
Click the Add icon to open the table form.
Enter the values in the form fields.
Click Create. The record appears in the table once the feature is created.
Edit a record
Click the Edit icon to open the table form.
Modify the desired field values.
Click Update. The new values appear in the subform.
Delete records
Select the records to delete.
Click the Delete icon. A confirmation message appears.
Attachments
If the form includes an attachment section and you have the required permissions, you can attach documents (images, PDF, Word, Excel files, etc.) or URLs.
The maximum file size is 20 MB.
Add an Attachment
Click the Add icon to open the file upload or URL entry window.
Enter the Subject and Description. Attachments are grouped by subject.
Click Save. The attachments appear in the form.
Modify a Feature
You can modify a feature in an editable layer if you have the necessary permissions.
Click the feature to display its tooltip. If the layer is editable and you have the required permissions, the Edit icon appears in the tooltip.
Click the Edit icon . A window opens with the available options based on your permissions:
Edit Geometry
Edit Geometry
Click Edit Geometry, then click the feature to select it. The vertices of lines and polygons appear.
To move the feature, drag and drop it to the desired location.
To modify its shape, click a vertex and drag it. Additional vertices appear between existing ones for finer adjustments.
Edit Information
Click Edit Information to open the form.
Modify the attribute values as needed.
If required, edit the subform as described in the section.
View and Manage Attachments
If a feature form contains associated documents, you can view and manage them. Management icons appear when you hover over a document.
Click the Edit icon to modify document information.
Click the Delete icon to remove the document.
To view documents:
Click a photo or image to enlarge it and display its subject and description.
Use the zoom controls to zoom in or out.
Click the Download icon to download the file.
Delete a Feature
Click Delete in the feature editing window. A confirmation message appears.
Click OK. The feature is removed from the layer.
Select Features on the Map
You can interactively select map features from one or more layers using the selection tools. You can then review the attributes of the selected features and export the information in various formats.
The interactive selection tools are available in the Selection panel.
Before selecting features, you must first make the features of the desired layers selectable. See the Making Layer Features Selectable section for details.
The Selection panel contains all available selection tools.
To Select Features
Click the Selection button to open the Selection panel. The icon changes color .
Select the desired tool by clicking it. The tool icon changes color. See the for details.
Select features on the map. Features from all selectable layers can be selected simultaneously.
Interactive Selection Tools
Selection Results
Selected features remain selected until they are deselected or the layer is made non-selectable.
Selected features are highlighted on the map.
The Selection panel displays:
The number of selected features and the number of affected layers
A list of layers containing selected features (with the number of selected features per layer)
Tools available for the selected features in that layer
Available Tools
Depending on the selected layer:
Zoom to selection:Centers the map on all selected features of the layer.
Open attribute table:Opens a displaying the attributes of the selected features.
Export to Excel: Downloads an Excel file containing the selected features’ attributes.
Feature Cards
For each selected feature, a card displays its attribute values.
Within each card, you can:
Navigate between selected features
Click a card to center the map on the feature
Return to the previous map view
Attribute Table
The Attribute Table displays the selected features’ attribute values in tabular format. Features are shown in rows and attributes in columns.
Click the Close icon to close the table (features remain selected).
Click the Display icon to display the table in a separate browser tab.
Close the tab to return to the table displayed with the map.
Sort Features
You can sort features based on the values of a given attribute:
Hover over the column header corresponding to the attribute.
Click the arrow to sort in ascending order.
Click again to reverse the order (descending).
Navigate Between Features
You can also use the attribute table to navigate between selected features:
Click a feature row in the table. The map centers on that feature.
Click Back to return to the previous view.
Styles
The style of a layer defines how spatial features are visually represented on the map. This representation can be uniform for all features or vary based on attribute values or map scale.
Styles are defined by a set of rules, allowing precise and diverse representation of layer data.
Each layer can have multiple styles. For example, a layer may use one style for map scales above 1:20,000 and another for scales equal to or below that threshold. A style might also display polygons representing city sectors, each colored according to the local crime rate.
You can enable or disable configured styles to determine whether they are displayed by default in JMap NG applications.
The Styles section, accessible via , provides the tools for configuring a layer’s styles. Each layer has a default style of the Single symbol type, which can be edited.
This function is replaced by the value of the bound attribute whose name is passed as a parameter for the pointed element.
Exampleev(id)
Label displays the value of the id attribute for this element.
format(attrib, format)
attrib: the name of a date or numerical attribute
format: the desired date format
Replaced by a number or date that was formatted according to a specific format.
Exampleformat(date_insp, dd/MM/yyyy)
where date_insp is the name of an attribute containing a date and dd/MM/yyyy is the desired date format, as indicated in the documentation of the java.text.SimpleDateFormat Java class.
Exampleformat(attrib, ##0,00)
where attrib is the name of an attribute containing a number and ##0,00 is the desired number format, as indicated in the documentation of the java.text.DecimalFormat Java class.
ifNull(attrib, value)
attrib : the name of the attribute to test
value : the value to display if attrib is null
This function is replaced by the value value only if the value of the attrib attribute is null.
If the attribute value is not null, nothing is displayed.
ExampleifNull(temp, N/A)
Displays N/A if the value of the temp attribute is null.
ExampleifNull(attrib_a, attrib_b)
Displays the value of the attrib_b attribute if the value of the attrib_aattribute is null.
ifNotNull(attrib, value)
attrib : the name of the attribute to test
value : the value to display if attrib is not null
This function is replaced by the value value only if the value of the attrib attribute is not null.
If the attribute value is null, nothing is displayed.
ExampleifNotNull(land_value, $)
Displays $ only if the value of land_value is not null.
lineLength()
This function is replaced by the length of a pointed line type element.
polygonArea()
This function is replaced by the area of a pointed polygon type element.
projectName()
This function is replaced by the name of the current project.
subString(attrib, startIx, endIx)
attrib: the name of the attribute for which a part must be extracted.
startIx: starting position in the character string. endIx: ending position in the character string.
This function is replaced by a portion of the value (as a character string) of the attrib attribute, between the startIx position and endIx position.
ExamplesubString(name, 0, 5)
Replaced by the first five characters of the name attribute value. If this value is Montreal, the mouseover will display Montr.
userName()
This function is replaced by the user code of the user that is currently connected.
Performs a simple search within the project content. See the section for more details.
Manage data layers
Displays the Layers panel. See the section for more details.
Select features
Displays the Selection panel. See the section for more details.
Measure distances and areas
Displays the Measurements panel. See the section for more details.
Annotate the map
Displays the Annotations panel. See the section for more details.
Manage your custom maps
Displays the My Maps panel. See the section for more details.
Export or print
Displays the Export / Print panel. See the section for more details.
Access documentation
Opens the JMap NG user and developer guides.
Configure your account
Displays the Profile and User Settings panel. See the section for more details.
Restore default rotation
Resets the map to its original orientation. See the section for more details.
Display your position
Displays your current position on the map (blinking dot). Click again to hide geolocation. Note: You must allow JMap NG to access your device's location.
Scale bar
The scale indicates the actual distance on the ground corresponding to the line displayed on the map. This distance changes automatically when you zoom in or out. The distance unit used corresponds to the one selected in the Profile and User Settings panel.
Open/close panels
Each panel displays a breadcrumb trail with the project name. To switch projects, click Projects in the breadcrumb trail.
Create a new feature
Visible only if you have editing permissions. See the Edit Data section for more details.
Display geographic information
Displays the map scale and cursor coordinates (latitude and longitude). You can modify the scale or center the map on specific coordinates. See the Navigating the Map section for more details.
Click the Panoramic icon to switch to panoramic mode (if available).
Click the Full Screen icon to display the image in full-screen mode.
Click the Exit Full Screen icon to return to the previous view.
Click the Close icon to close the image.
Point
1. Click the desired location to place the point.
2. To reposition it, click and drag it to a new location.
Line
1. Click to place the first point.
2. Click additional locations to add vertices.
3. Double-click to complete the line.
4. To modify it, click a vertex (it becomes highlighted) and drag it. Additional vertices appear between existing ones for finer adjustments.
1. Click to place the first vertex.
2. Click to add additional vertices.
3. Double-click to complete the polygon.
4. To modify it, click a vertex and drag it. Additional vertices appear for more precise adjustments.
Hold down the ⌘ (Mac) or CTRL (Windows) key to add features to your selection using the same or a different tool. The selection help indicates how to add or remove features.
Polygonal selection:Allows you to select features by drawing a polygon. All features fully or partially within the polygon are selected.
Click to define the first vertex.
Click to define additional vertices.
Double-click or press the Spacebar
Deselect layer features: Deselects features from the selected layer only (features from other layers remain selected).
Maximize or minimize the card
Edit the feature (if permitted)
Deselect the feature (other selected features remain selected)
Point selection:Allows you to select one feature at a time by clicking it.
Click a feature to select it.
Hold ⌘ or CTRL and click another feature to add it to the selection.
Hold ⌘ or CTRL and click a selected feature to remove it from the selection.
As you select features, their information appears in the Selection panel.
Line selection: Allows you to select features by drawing a line. All features crossed by the line are selected.
Note: This option does not work with point layers.
Click once to define the starting point of the line.
Drag the pointer to draw the line.
Double-click or press the Spacebar to finish the line.
Drawing a new line clears the previous selection made with the Line tool.
Circular selection: Allows you to select features by drawing a circle. All features fully or partially within the circle are selected.
Click once to define the center of the circle.
Drag to set the radius.
Click again or press the Spacebar to complete the circle.
Drawing a new circle clears the previous circular selection.
Rectangular selection:Allows you to select features by drawing a rectangle. All features fully or partially within the rectangle are selected.
Click once to define one corner of the rectangle.
Drag to define the rectangle.
Click again to define the opposite corner.
Drawing a new rectangle clears the previous rectangular selection.
Click + to add a style.
Three style types are available: Unique symbol, Unique values, and Classification. Details are presented in the following sections.
The last style you add is displayed at the top of the section.
The layer has a default style, Unique symbol, which you can modify.
2
Each style has:
A name.
A checkbox: Check the box to enable the style's display in JMap NG.
An interface containing the style's settings. The interface can be collapsed and expanded using the arrows.
3
The parameters that define the style vary depending on the type of style and the type of element to be represented (point, line, polygon, text).
Unique Symbol
This style uses the same symbology for all features, with the possibility to vary based on map scale. It is the only style applicable to raster data.
Style name
Each style has a default name, which can be changed by clicking .
To the left of the name, a checkbox lets you enable or disable the style’s visibility on the map. When enabled, the style is shown by default in JMap NG.
Scales and zoom levels
These two parameters define the range of zoom levels in which the style is applied.
Scales are expressed as zoom levels, from 0 (global view) to 23 (highly detailed view, such as part of a building).
Scales: shows values from 0.0 to 23.0.
Zoom Levels: shows a bar with two draggable handles representing the selected interval.
To define a zoom levels range:
Hover over the scale values to display + icons.
Click a + to insert an intermediate point (e.g., 0.0 → 11.5 → 23.0).
Adjust the new value by dragging the handle or editing the value directly.
Repeat to add more points.
To remove a range, click the icon next to the handle.
Opacity
This section, present in raster data sources, allows you to define the opacity level of the image for each scale interval you have defined.
Symbol
This section lets you define how features are symbolized within each scale range if needed.
Options vary depending on the feature geometry and are detailed in the Vector Features Symbology section.
Unique Values
This style represents features using different symbology based on an attribute’s value.
Style Name
The style has a default name, which can be changed by clicking .
To the left of the name, a checkbox lets you enable or disable the style’s visibility on the map. When enabled, the style is shown by default in JMap NG.
Attribute
Use the dropdown menu to select the attribute for the style.
Supported types: text, date, or numeric.
Maximum: 500 unique values.
The attribute must be enabled in the Properties section to be used.
Zoom levels
Select the zoom levels range where this style will be active, using the same method as for Single Symbol.
Conditions
Expand this section to display and configure unique value conditions.
Click to select an automatic color palette (divergent, single hue, multihue, etc.).
Click the arrow next to each condition to access its symbology settings.
Click to rename the condition for the legend.
Click to remove the condition. Others remain unchanged.
Vector Features Symbology
The components of the Symbol section vary depending on the layer's features.
Points
You can compose a symbol for point features using multiple stacked icons.
Click + to add an icon.
Click to remove one.
Each icon opens a tab with its parameters.
Icon
The drop-down menu allows you to select the vector icon.
Color
Select the icon color. You have several methods: color field, color bar, RGB and HEX codes.
Opacity
Specify the degree of opacity of the icon color.
Size
Specify the icon size. A value of 1 corresponds to the original icon size.
Rotation (º)
Lines
You can build line feature symbols by layering multiple line styles.
Click + to add a line style.
Click to remove one.
Each style opens a tab with its configuration options.
Color
Select the line color. You have several methods: color field, color bar, RGB and HEX codes.
Opacity
Specify the degree of opacity of the line.
Line style
Click the icon to specify the line style, which consists of:
Line end
Line junction
Dash pattern. Press + to specify whether the line is dashed and to determine the size of the dash and the space between dashes. You can add multiple dash sizes and spacings, which will be drawn one after the other.
Thickness
Specify the thickness of the line.
Polygons
These are the parameters that define the symbology of polygonal elements:
Fill color
Select the polygon's fill color. You have several methods: color field, color bar, RGB and HEX codes.
Opacity
Specify the degree of opacity of the polygon's fill color.
Border color
Select the polygon's border color. You have several methods: color field, color bar, RGB and HEX codes.
Opacity
Specify the degree of opacity of the polygon's border.
Thickness
Texts
You can specify these parameters:
Font
Select the text font.
Bold
Select this option to use the bold font.
Italic
Select this option to use the italic font.
Color
Select the text color. You have several methods: color field, color bar, RGB and HEX codes.
Contour
Add Annotations to the Map
You can add annotations such as drawings or text to the map. Annotations can be saved along with the map when exporting to PDF.
The Annotations panel contains all drawing tools available in the application.
To open the panel, click the Annotations button . The icon changes color .
Using the Annotations Panel
Click the desired drawing tool to activate it. See the section for details.
Create the desired drawings. You can switch tools to create different types of annotations. Drawings remain visible until you delete them.
The panel includes:
Drawing tools for different types of annotations
Select button – Select annotations
Delete button – Delete selected annotations
Drawing Tools
Annotation Style
Fill
This section defines the color and transparency of points, circles, rectangles, and polygons.
You can define the fill color using:
Visual color selector (color bar and color field)
Hexadecimal code (Hex)
RGB values
Opacity percentage
A color history displays recently used colours.
Line
This section defines the appearance of lines and outlines of circles, polygons, rectangles, and points.
Options include:
Line thickness
Color (via visual selector, Hex, or RGB)
Opacity percentage
Color history
Text
This section defines text appearance.
Options include:
Font size
Rotation angle
Color (visual selector, Hex, RGB)
Color history
Modify Annotations
You can modify the shape, appearance, position, or rotation of annotations, or delete them.
You can modify the shape of one drawing at a time. You can modify the appearance, location, or delete multiple annotations simultaneously (text and drawings must be modified separately).
Modify Appearance
Click Select.
Click a drawing or text to select it.
Hold the SHIFT key to select additional annotations of the same type.
Modify Shape (Drawings Only)
Click Select.
Click a drawing to select it. Its vertices appear.
Click a vertex to select it.
Move Annotations
Move Text
Click Select.
Click a text annotation.
Drag it using the hand cursor.
Move Drawings
Click Select.
Click a drawing.
Hold the SHIFT key to add other drawings.
Rotate Annotations
You can rotate either a selection of drawings or a selection of text (not both together).
Click Select.
Select the drawings or text annotations.
Hold the SHIFT key to add more.
Delete Annotations
Click Select.
Select the annotations to delete.
Hold the SHIFT key to select multiple annotations of the same type.
Specify the rotation (in degrees) to apply to the icon.
Offset X and Y
Adjust the symbol's origin point by offsetting the symbol in X and Y directions by the specified values.
The origin point corresponds to the precise coordinate of the point element.
Specify the thickness of the border.
Dash pattern
Press + to specify whether the polygon's border is dashed and to determine the size of the dash and the space between dashes.
Click on the icon to activate contour drawing and select its color. You have several methods: color field, color bar, RGB and HEX codes.
Opacity
Specify the degree of opacity of the text.
Double-click to complete the polygon.
The appearance is defined in the and sections.
Click OK to save or Cancel to close without saving.
Or pass them as a JS object, through a globally scoped JS variable named JMAP_OPTIONS, like this:
All options are available as JS parameters, and some are also available as URL parameters. All URL query parameters are prefixed with "ng", to avoid naming collisions with eventual third-party query parameters (especially true if JMap NG is embeded in a div for instance).
JMap NG Core
The following tables present the list of JMap NG Core library's startup options:
Core options
Core Map options
Map options are gathered in a "map" json object in the javascript configuration.
JMap NG App
The following table presents the list of JMap NG App's startup options:
If true, the lib will try to log in as an anonymous user. ()
anonymous: true
ngAnonymous=true
true | false
Disable project change
If true, changing project (after one has been loaded) will be disabled. ()
disableProjectChange: true
ngDisableProjectChange= true
true | false
Extensions
You can provide your own Core extensions. ()
{ extensions: [ … ] }
-
json / javascript
Extensions overrides
During the development of a project extension, you can use this option to load your local code instead of the project's extension's jsUrl. ()
{ extensionsUrlOverride: [ … ] }
-
json
Enable/Disable Geolocation
By default, the geolocation is activated (if the browser supports it). You can disable the geolocation by using this option. ()
geolocationEnabled: false
ngGeolocationEnabled =false
true | false
Disable UI visibility
If set to true, NG Core will not display a basic UI providing loading progress information, a login form and a project list. By default, this option is disabled in NG App. ()
hideMainLayout: true
-
true | false
Legacy authentication
If set to true, will revert to a REST API-based authentication setup ()
legacyAuthentication: true
ngLegacyAuthentication=true
boolean
Project thumbnails
If true will load all project thumbnails (base 64 images) asynchronously. ()
loadProjectThumbnails: true
-
boolean
Session language
If set to any of the locales supported by JMap NG, it will define the session locale, bypassing browser or user-defined locale. ()
locale: “en“
ngLocale=fr
string
Organization id
The JMap Cloud organization id. Used when passing a session refresh token (see below). ()
organizationId: "my-organization-id"
organizationId="my-organization-id"
string
Project id
Id of the JMap project to open. ()
projectId: "57ec1ca5-ddb8-4c71-ace4-0571129b017c"
ngProjectId=57ec1ca5-ddb8-4c71-ace4-0571129b017c
string
Project name
Name of the JMap project to open. If both a project id and a project name are provided, project id will be used. ()
projectName: “World“
ngProjectName=The world url encoded => ngProjectName=World
string
Projects loaded callback
You can provide some JS code to be executed when all project definitions have been loaded from the backend. ()
A JMap Cloud refresh token used to initiate a session. If valid, will be used to identify the user. ). Using this option will automatically activate the legacy authentication.
token: “v1.MRq[.....]Rehef72YWws“
ngToken=v1.MRq[.....]Rehef72YWws
string
Center
Will center the map on the specified point. (). This option is overridden by the extent option
map: { center: { x: 12.4, y: 45.34 } }
-
json
Html container id
You can place the map in the HTML div of your choice by identifying the div in the map parameter. If not set, a div is appended in the body root. ()
map: { containerId: “my-div“ }
-
string
Initial Extent
Will adjust the map to fit the extent when it first loads. (sw = bbox south-west, ne = bbox north-east) (). This option has precedence over the following options: bearing, center, rotation and zoom
By default, the map rotation control is visible, but can be hidden with this parameter. (). This option is overridden by the extent option
map: { mapRotation ControlVisible: true }
ngMapRotationControl Visible=false
true | false
Google Maps Api Key
This option is not yet available for JMap Cloud.
If no Google Maps API key is set in the JMap Cloud or JMap Server configuration, you can provide the API key as a JS parameter. The Google Maps API key is not mandatory, but if you don't provide one you won't have access to the Google Maps basemaps. (API doc)
map: { googleMapsApiKey: “Bse….32k“ }
-
string
Mapbox token
If no Mapbox access token is set in the JMap Cloud or JMap Server configuration, you can provide the token as a JS parameter. The Mapbox token is not mandatory, but if you don't provide one you won't have access to the Mapbox basemaps. ()
map: { mapboxToken: “xgb….4f5“ }
-
string
Navigation history control visibility
By default, the navigation history control is visible, but can be hidden with this parameter. ()
map: { navigationHistory ControlVisible: true }
ngNavigationHistory ControlVisible=true
true | false
Map ready callback
This function is triggered only once, the first time the map is loaded. ()
By default, the scale control is visible, but can be hidden with this parameter. (
map: { scaleControlVisible: true }
ngScaleControlVisible=false
true | false
Map Info-control visibility
By default, the Map Info control is visible, but can be hidden with this parameter. ()
map: { mapInfoControlVisible: true }
ngMapInfoControlVisible=false
true | false
Terrain-control visibility
By default, the Terrain control is visible, but can be hidden with this parameter. (
map: { terrainControlVisible: true }
ngTerrainControlVisible=false
true | false
Search
When the map is loaded, will execute a search by attribute(s) on the layer, and zoom to the matching features. You can search using multiple attribute values by passing an array in the javascript form, or by passing trailing values in the URL form. An optional parameter lets you specify to display a MouseOver popup on the result feature. This popup will only be displayed if the showMapPopup parameter is true, and if there is only one result to the search. In the URL form, showMapPopup must be passed as a keyword, and at the beginning of the query string ()
You can set a custom background image for the login screen by setting an image url. This image will be displayed to the left of the JMap NG login form. (). Only effective when using legacy authentication
You can set a custom logo image by setting an image url. The logo will be displayed above the JMap NG login form. (). Only effective when using legacy authentication
You can set a custom background image for the project list screen by setting an image url. This image will be displayed to the left of the project list. ()