Loading...
Loading...
Loading...
Loading...
Loading...
Loading...
Loading...
Loading...
Loading...
Loading...
Loading...
Loading...
Loading...
Loading...
Loading...
Loading...
Loading...
Loading...
Loading...
Loading...
Loading...
Loading...
Loading...
Loading...
Loading...
Loading...
Loading...
Loading...
Loading...
Loading...
Loading...
Loading...
Loading...
Loading...
Loading...
Loading...
Loading...
Loading...
Loading...
Loading...
Loading...
Loading...
Loading...
Loading...
Loading...
Loading...
Loading...
Loading...
Loading...
Loading...
Loading...
Loading...
Loading...
Loading...
Loading...
Loading...
Loading...
Loading...
Loading...
Loading...
Loading...
Loading...
Loading...
Loading...
Loading...
Loading...
Loading...
Loading...
Loading...
Loading...
Loading...
Loading...
Loading...
Loading...
Loading...
Loading...
Loading...
Loading...
Loading...
Loading...
Loading...
Loading...
Loading...
Loading...
Loading...
Loading...
Loading...
Loading...
Loading...
Loading...
Loading...
Loading...
Loading...
Loading...
Loading...
Loading...
Loading...
Loading...
Administrative functions for the organization, including subscription management, are exclusively reserved for administrators.
These tasks are performed in the Organization section of the JMap Cloud Portal, which is organized into the following tabs:
Each tab provides the tools and settings required to effectively manage the organization’s resources and members.
Coming soon.
To add data to the project, you must select a data source, drag it, and drop it onto the map.
Spatial data appears in the project Layers section.
Tabular data is displayed in the Tabular data section.
Coming soon.
JMap Cloud is a cloud-based geospatial platform designed for developers and system integrators who need to add advanced mapping capabilities to their applications. It offers cloud services and robust APIs that simplify the integration, visualization, and querying of heterogeneous geospatial data from various formats (vector, raster, web services) and sources (OGC services, local files, etc.).
The platform is built around containerized, interoperable, and scalable microservices, ensuring high availability, dynamic scalability, and smooth integration into existing technology ecosystems. It complies with geospatial industry standards (OGC, GeoJSON, WMS/WFS, etc.), making it easily interoperable with existing GIS systems or business applications.
The following figure illustrates the architecture of JMap Cloud, including its main services (authentication, data management, map rendering, etc.), possible interconnections with the organization’s information systems (databases, internal web services), as well as front-end interfaces used by end-users via mapping applications.
JMap Cloud Portal serves as the web management interface for the platform. It provides administrators and authorized users with advanced visual tools to:
Import geospatial and non-spatial datasets;
Create, configure, and publish mapping projects;
Manage users, roles, and access rights;
Monitor the technical ecosystem connected to JMap Cloud.
In summary, JMap Cloud Portal enables centralized governance of an organization’s geospatial data and mapping services in a secure, flexible, and scalable cloud environment.
This section introduces extensions, also known as modules, which add specific features to JMap Cloud.
Each extension is displayed as a card showing the following details:
Extension name
Publishing organization
Version
Description of available features
Representative image
Link to more information
A toggle switch allows you to enable or disable the extension.
Extensions can be added to .
Projects that you have created (and of which you are then the owner) as well as projects for which you have access permissions appear in the Projects section.
Two display modes are available in this section: table mode, similar to the display mode of other JMap Cloud Portal resources, and card mode. You can switch between modes by pressing the and icons respectively.
When projects are displayed in list mode you can sort and filter them based on their name or modification date.
The name, number of layers, and visibility (public or private) settings are displayed for each project.
The menu icon available in both display modes offers functions for managing each project: , , , , , , . The following sections describe these functions in detail.
To open the project to explore it and fine-tune the configuration before making it available to users:
Click and then on Open in JMap NG. A JMap NG application displaying the project opens in a new tab.
Log in to the application with your JMap Cloud Portal login information.
Navigate the map and explore the app. The functions offered by JMap NG are available (see details in the ). It is the cartographic application that disseminates the project to members whose role is Viewer.
In JMap NG, click and then Logout to close the application.
To display and/or edit project settings:
Click and then Settings. The project configuration interface appears.
Edit project settings. You can edit all settings.
Click Update to save changes. The edit date is displayed in the Modification column when the project is viewed in List mode.
The layer order in the map is the order in which the layers are drawn on the map. The bottom layer is drawn first, followed by the layer above, which is drawn on top of the first, and so on until the last layer, the one at the top of the layer stack, is drawn.
The order in which the layers are drawn on the map is important because, depending on the layer's transparency, images (raster layers) could, for example, obscure lower-positioned layers, just as polygon layers could obscure point or line layers.
To determine the map layer order:
Activate the tool by clicking the Layer ordering icon.
In the Layer ordering window, select the layer you want to move. You can select the layer by clicking its name or the arrow icon that appears to the left of the layer name.
Move the layer to the desired position and drop it. The map reflects the change in real time.
You can delete a project for which you have Owner permission. Deleting the project deletes the project's map layers and tables as well as these configurations.
To delete a project:
Click and then Delete. A message asks you to validate your choice.
The project disappears from the Projects section.
Layer groups allow you to better organize layers based on different criteria such as the layer's theme (sewer network, transportation, regulations, etc.), production date (current year, etc.), etc.
To add a group to the project:
Click Add Group. The new group, Layer group, appears in the Layers section.
Double-click the new group to edit its name. By clicking on the labels for each language, you can enter the group name in each language.
Select a layer to add it to the group.
With the cursor over the layer icon , drag and drop it into the group.
This function allows you to return to the map display as established by enabling or disabling the display of each layer.
You can therefore enable or disable the display of layers while you configure the map and project. When you press Reset display, the map returns to the default layer display.
Once the data is connected, the next step is to organize it into projects that can be disseminated to end users through mapping applications.
A project is composed of an ordered list of layers and non spatial data tables. A JMap Cloud mapping application opens projects and displays their layers and data tables. You can create as many projects as you want.
Each layer of a project is associated with a . The data source provides the layer data. Different projects can contain layers sharing the same data sources, allowing for a variety of styles and information for displaying the same data. It is also possible for several layers of the same project to share the same data source, using filters.
A project is a secure resource, which means that it has permissions associated with it to control access by end users. It is therefore possible to exercise precise control over which users will be authorized to open each project.
The Projects section of JMap Cloud Portal allows you to create and manage projects. You can also create projects directly from the .
The following sections describe the steps for creating a new project as well as managing the projects you have access to.
Some map elements will display a tooltip when you touch them or when you click on them. The tooltip contains information on the element's attributes, and it can include text, hyperlinks to open documents or videos in their native applications, photos, etc.
Sometimes elements from several overlaying layers have tooltips. In this case, when you open the tooltip of an element, it displays the contents corresponding to each overlaying element, being that of the upper layer displayed first, followed by the contents of the elements of the lower layers. The order of display of the content in the tooltip follows the order of overlay of the layers.
Tooltips are displayed temporarily for one element at a time.
To display a tooltip:
Click on an element whose tooltip you wish to display. The tooltip automatically appears.
Click on to close the tooltip or click on another map object to open its tooltip.

A JMap Cloud administrator from your organization will send you an invitation email to join JMap Cloud Portal. This email, sent from JMap Cloud, includes a link that takes you to the account creation page.
The account setup interface displays your email address and a field to create your password, following the listed password requirements.
Once you've set your password, click Continue to proceed with the login steps described in the next section.
If you already have an account, you can simply click Login to access the platform directly.
Once your account is created, you can access JMap Cloud Portal in one of two ways:
By visiting the main website https://www.jmapcloud.io and clicking the Login button;
Or directly via the portal URL: https://portal.jmapcloud.io/login.
To complete the login process:
Click Login to open the authentication page.
Enter your email address and password, then click Continue. Once authenticated, a screen will prompt you to select your organization.
Click the button corresponding to the organization you want to connect to. Another authentication step is performed, after which you’ll gain access to that organization’s JMap Cloud Portal.
The home interface displays the dashboard, which summarizes the JMap Cloud resources available to you based on your permissions.
The Layers section offers several tools to organize the project's layers, making it easier for end users to work with the applications.
In addition, each layer and layer group offers tools to control its display and therefore the map content.
Specifically, you can:
Establish the order of the map layers
Establish the order of the layers in the Layers panel in Studio and JMap NG
Focus the map on a layer by displaying only that layer
Add layer groups
Remove a layer or layer group from the project
Control the display of a layer or layer group in the map
You can update the data of a vector spatial data source or a non-spatial data source. This process allows you to replace the file or web service that provides data to the data source (DS).
1. Open the Update Interface
Select the Update Data function to access the interface where you can:
upload a new file,
select an existing file already stored in JMap Cloud,
or, in the case of a web service, reconfigure the connection query.
If the selected file is not compatible with the existing data source, an error message will appear.
2. View and Edit Information
The interface displays the current properties of the data source:
Name,
Coordinate Reference System (CRS) (for spatial DS),
Description,
Tags.
You can keep these values as they are or update them as needed.
3. Review and Configure Attributes
The attributes of the new file are shown. You can index specific attributes to facilitate searches. Depending on the file format, some additional parameters must be completed. These are explained in the spatial data file and tabular data file sections.
A new table is created in JMap Cloud with the updated data. The previous table is automatically deleted.
4. Finalize the Update
Click Save. Once the changes are applied, the status of the data source is updated to Ready.
If the CRS of the new file is different from the one configured for the data source, the data will not be displayed on the map when using the View Information function.
5. Impact on Map Layers
The new file may differ from the original in terms of format, CRS, geometries, or attributes. In such cases, you will need to update the configuration of the map layers that use this data source.
To delete a data source:
Select the Delete option from the DS menu.
A confirmation message will appear, listing any map layers or project tables that use this data source.
Click OK to confirm and delete the data source.
The original data file used to create the DS is not deleted. It will remain available in the Files tab for 10 days, after which it will be automatically removed from JMap Cloud.
JMap NG is an online cartographic application that offers users an interactive tool for navigation, querying and editing spatial and descriptive data from JMap Cloud
Users of JMap NG applications are required to create, view, update, and delete data as part of their tasks. These operations are carried out using forms configured in JMap Cloud Portal for both spatial and non-spatial data sources.
The Forms section displays a table listing the configured forms associated with the data sources you have access to.
The Create a new form button opens an interface that allows you to:
select a data source,
assign a name to the form,
and add tags.
Clicking Create takes you to the form design interface, which is described in detail in the following section.
Each form includes a menu that provides the following options:
Settings: View the associated data source and modify the form’s title and tags;
Edit form: Opens the form design interface (see the next section for more information);
Delete: Permanently removes the form.
The Layout tab provides tools to visually arrange the components of your form.
By default, components are stacked vertically. The layout tools allow you to customize this structure by using containers that define flexible layouts. These containers can hold other containers or components, enabling highly customizable form designs.
To add a container, drag it from the panel and drop it into the Design tab interface at the desired location. Guide lines will appear to help you place the container in valid positions.
This approach allows you to create an infinite variety of simple or complex layouts.
Horizontal
This container creates a row in which multiple components or containers can be placed side by side.
Vertical
This container creates a column, where components or containers are arranged one above the other.
Group
This container allows you to group components or containers, helping to structure long or complex forms. Click the group container to set a title in the Properties section.
Tab
This container lets you create tabs to better organize forms with many components. Tabs can be placed inside other containers. Click the tab container to edit its default title in the Properties section.
Space
This container adds spacing between two components or containers, useful for improving the visual clarity of the layout.
The first step in the map‑publishing workflow is to connect JMap Cloud to your data by creating data sources (DS).
A data source is any service or file that provides information to JMap Cloud, including:
Spatial data (vector or raster)
Non‑spatial tabular data
JMap Cloud supports several types of data sources:
Spatial DS
Vector files (GeoJSON, Shapefile, etc.)
Raster files (e.g., GeoTIFF)
WMS / WMTS services
Vector tile services
Feature services (OGC)
Non‑spatial DS
CSV files
Synchronization with JMap Server A JMap Server administrator can synchronize data sources, layers, or even entire projects from a JMap Server instance into JMap Cloud. For more details, see the JMap Server Administrator Manual.
In the Data Sources section of JMap Cloud Portal, you have tools to:
Upload files (vector, raster, or CSV) to create new data sources.
Configure direct connections to external data services (WMS, WMTS, vector tiles, feature services).
Once created, these data sources are immediately available for creating map layers and tables within your projects.
This section displays the tasks that your organization runs on JMap Cloud. Its purpose is to provide information on problems that may appear when performing some functions.
A table displays a task in each row and the following attributes in columns:
Type
Indicates the type of JMap Cloud module involved in the executed task: Load, Analysis, Seed, etc.
Id
Unique identifier of the task.
Status
Task execution status: Failed, Successful, Cancelled, etc.
Message
A very brief message describes the task performed.
Progress
The degree of completion of the task, in percentage.
Creation
Date the task was created.
Start
Start date of the task.
End
End date of the task.
Update
Task update date.
Members with the Administrator role view all of the organization's jobs in the table.
Members with the Editor role view only the jobs they have started.
A job can only be canceled by the member who started it.
This section displays a table of the organization's member groups, along with a button to create new groups. When an organization has many members, organizing them into groups based on various criteria can greatly simplify tasks such as assigning resource access permissions.
The table shows the name of each group and the number of members it contains.
A menu in the header of each column allows you to sort, filter, hide, or display attributes.
Another menu , available when hovering over a group, gives access to options to edit or delete the group.
To create a group:
Click Create a group.
Enter a name for the group (between 2 and 250 characters), then click Create. Group names must be unique within the organization. The new group will then appear in the table.
You can edit a group's name and its composition (i.e., add or remove members):
Hover over the group's name, click the menu, and select Edit.
To change the group’s name, enter the new name and click to save or to cancel.
To add a member, use the Member name or email field to select a member from the dropdown list or type their name or email directly.
Once the members are selected, click to include the members. The members will be listed with their name, email, and role.
To remove members, check the boxes next to the members you wish to remove, then click .
To delete a group:
Click the menu next to the group name.
Select Delete.
Confirm the deletion when prompted.
Studio is the section of JMap Cloud that allows you to configure a project, adding spatial or tabular data, and organizing and configuring layers.
The Studio interface is accessible through a project's menu when you select Open in Studio.
1
Project name.
2
Available data sources.
You can view the DS you have permission to access. When you hover over the DS, icons indicating the data type are displayed.
3
Tool to define the initial extent of the project.
4
Layers.
Icons indicate the functions available for the layer set. List of map layers. When you hover over the layer, icons indicating the functions available for the layer are displayed.
5
Tabular non spatial data. Tabular date displays in this section.
6
Zoom. As you zoom in and out of the map, the zoom level is displayed here. The level ranges from 0, which shows the entire planet (the furthest you can zoom out), to 23, which shows a very detailed small area (the furthest you can zoom in).
7
The map instantly reflects the added data and their configurations.
The following sections detail the features offered.
Two tools allow you to control the display of layers and layer groups. One allows you to enable and disable the display of the layer or group, while the other allows you to enable and disable the visibility settings configured for the layer or group. These are explained in detail in the Properties section.
To access the functions:
Hover over the layer or group to display their function icons.
Click or to disable or enable the display of the layer or group.
Click or to disable or enable the application of the visibility setting for the layer or group.
This section allows you to name your organization and copy its unique identifier, which is required to access JMap Cloud Portal from external systems or platforms.
Enter the organization's name in the Name field.
To copy the organization's unique identifier to the clipboard (for example, to use it in an external configuration), click the icon.
The unique identifier is used to establish connections between JMap Cloud and other systems, such as JMap Server, which relies on it to authenticate its connection to JMap Cloud.
For more details, refer to the JMap Server Administrator Manual.
When the visibility of a project is Public, users access the project without the need for authentication.
When visibility is Private, users must have at least View permission to access the project.
To obtain the sharing link to share a Public project:
Click and then on Get the public link. This function is inactive for projects with Private visibility type.
You can copy this link also from the project configuration interface. This is relevant when you make a project Public:
Click and then on Edit to open the project configuration interface.
If you have Owner permission, check the Public box to make the project public. The icon appears next to the box.
Click to copy the project share link to the clipboard.
The configuration panel of each non-spatial data table provides tools to configure the general properties of the table that will be accessible through the JMap NG application.
1
Click on the DS to open its interface.
2
Table name. You can modify it by clicking .
3
Description of the dataset. You can modify it by clicking .
4
Check this box to enable editing tools. This will allow JMap NG application users with the appropriate permissions to edit the table data.
5
Table fields. You can view the contents of the fields by displaying the data source interface.
Each form is linked to a data source, whether spatial or non-spatial.
Forms are built using components arranged in either simple or complex layouts, depending on the requirements. In most cases, each form component is directly associated with a field or attribute from the data source, which is accessed through the layer or table connected to that source in JMap NG.
The form design interface allows you to define both the content and the layout of the components.
The illustration below shows the main sections of the form design interface.
1
Components tab.
2
Available .
3
Design tab.
4
Design tab interface that displays the components added to the form.
5
Properties of the component or arrangement selected in the Design interface.
6
Layout tab.
7
Component for form layout.
8
Preview tab.
9
Preview tab interface showing how the form looks in a JMap NG application.
When the project contains many layers with enabled display, the map may be less easily readable.
To make it easier to view a particular layer without having to disable the display of other layers, focus mode is a useful option. When you enable this mode and select a layer, the other layers in the project are not displayed in the map. You can quickly change the layer to be displayed, and simply disable the function to return to the map as configured.
To use focus mode:
Click to enable the Focus mode.
Click the name of the layer you want to display alone in the map. The layer configuration panel appears, and the map displays only that layer.
Click the arrow to return to the Layers panel. The map displays all layers with enabled display. The Focus mode tool remains active.
Select another layer by clicking on its name. The configuration panel opens, and the map displays only that layer.
In the layer control panel, click to disable Focus mode. The map displays all layers whose display is enabled.
The order of layers in the Layers panel of Studio and JMap NG is intended to make work easier for users, especially when projects contain many layers.
To set the layer order in the panel:
In the Layers panel, hover over the layer you want to move until the icon appears.
Click and drag the layer to the desired location and drop it. The map remains unchanged. The Layers panel displays the new order.
This section allows you to configure the layer properties, through the following parameters:
Source
Indicates the layer's data source. Click the data source name to open the data source description interface.
Name
The name of the layer. You can modify the name.
Description
Description. Optional parameter.
Zoom levels
Select the zoom levels at which the layer is visible. 24 zoom levels are available. Level 0 corresponds to the entire planet (maximum zoom out), while level 23 corresponds to the closest zoom to a point on the map (maximum zoom in). Restricting the visibility threshold of some layers improves application performance and map readability. This visibility threshold can be enabled or disabled using the layer's switch ( and ).
Rotation
Point features only. Check this setting to rotate the layer's elements based on a quantitative attribute. You must select the attribute and the rotation direction (clockwise or counterclockwise).
Generalization level
Select a generalization level. Generalization is the simplification and adaptation of the layer's content to make the map more readable and the application more efficient without losing accuracy. Four options are available: None, Low, Medium, and High.
Enable editing tools
Check this setting to provide layer data editing tools to application users with the necessary permissions. If this option is enabled, layer data is no longer cached.
Attributes
This section displays the list of layer attributes. The attributes are listed in alphabetical order. Name, title, and type (double, integer, varchar, date) are displayed for each attribute. When you check an attribute, it becomes available for use in styles, labels, and popups. It is moved to the top of the list. When you uncheck it, the attribute is no longer available for configuring styles, labels, or popups and returns to its original position in the list. You can edit the title of each attribute:
Check the attribute you want to edit. The attribute is moved to the top of the list, and the Title field becomes editable.
Enter the title and accept the change.
The language button allows you to select the available languages to provide the information in each language.
Each layer's control panel offers tools for configuring general layer properties, styles, labels, and tooltips. The available tools vary depending on the layer type (vector or raster).
Icons provide access to each section.
1
Sections: Layer properties
Styles
Labels
Popups Layer filters
Focus mode: click on this to applay the to the map.
2
Each section displays the settings to configure. These vary depending on the layer type, vector or raster, and the elements of the vector layer: points, lines, polygons, annotations.
3
The map reflects real-time configurations.
You can create data sources (DS) from five types of support:
Vector or raster data files: Various formats are supported (SHP, CSV, GML, GeoJSON, FileGeoDB, GeoPackage, DWG, TAB, GeoTIFF)
Non-spatial tabular data files
WMS/WMTS services
Vector tile services
Feature services
The Data Sources tab allows you to create and manage the data sources you will use in your projects.
This section displays a table listing the data sources you own, as well as those you have permission to access. For more details on access and resource management, see the section.
Each data source appears as a row in the table. The columns provide the following information:
Name of the data source
Source type
Status
CRS (Coordinate Reference System)
Number of features (for vector and tabular data sources)
Tags
Last modified date
To create a new data source, click the Create a data source button. A dropdown menu will allow you to select the source type:
Vector/Raster data file
Tabular data file (non-spatial)
WMS/WMTS service
Vector tile service
Feature service
The following steps will vary depending on the selected source type.
This guide outlines the main steps involved in publishing data from JMap Cloud through a web mapping application, either public or restricted.
Within an organization, each user is assigned one of three roles in JMap Cloud: Administrator, Editor, or Viewer. The section provides detailed descriptions of the responsibilities associated with each.
Only Administrators and Editors have access to JMap Cloud Portal, the management interface for the platform. Viewers access data exclusively through web mapping applications.
While Administrators and Editors can see all sections of the portal, only the features corresponding to their role are enabled.
The diagram below summarizes the general workflow, indicating which roles are involved at each stage.
In this step, the Editor connects data to JMap Cloud by creating data sources. These may include GIS files, spatial data servers, satellite imagery, or non-spatial tabular data.
There are two main ways to connect data:
Upload files, which are then copied to JMap Cloud’s internal databases;
Create connections to external web data services to make the data accessible for project configuration.
For more information, see the section .
Data in JMap Cloud is organized into projects. A project contains:
the definition of map layers,
access control settings (security),
unit preferences,
and other display parameters.
By creating a project, the Editor defines the visual appearance of the map, the data it will include, and the users who will be granted access.
For details, refer to .
At this stage, the Editor creates map layers using spatial data and adds non-spatial tabular data to the project. Each layer or table is linked to a specific data source.
For each map layer, the Editor configures:
style (how the features are drawn),
labels,
tooltips,
visibility thresholds, and more.
See the section for additional details.
Once the project is complete, it is published through web mapping applications for end users.
Depending on the access control settings defined by the Editor, the applications may be:
publicly accessible, or
restricted to authenticated users with the Viewer role.
For more information on these applications, refer to the .
You can select the layers to display in the map.
To display a layer, you must display the group and the subgroups in which the layer is found.
Slide the switch on the group's card from to in order to enable the display of the group.
Click on to open the group card and display the layers and subgroups it contains.
Slide the switch on the subgroup's card to enable its display. The icon of the subgroup will change color .
The icon appears in the layers' cards whose display is disabled. No icon appears in layers' cards whose display is enabled.
Click on to display the layer. The icon disappears, and the layer is displayed in the map.
To disable the display of a layer, bring the mouse pointer to the card of that layer. The icon appears.
Click on the icon, which turns to . The layer will no longer be displayed in the map. Its symbol will turn gray.
Slide the display switch of the group to this position if you wish to disable the display of all layers comprising this group. Even the layers whose display is enabled will no longer be shown.
Some layers are configured to be displayed within a given scale interval. Displaying an abundance of small map elements when a small scale is selected (i.e. when the map displays a large territory with few details) can make it very difficult to read the map. Layers that have elements with these characteristics are usually displayed at a larger scale, when the map contains more details on a limited territory.
When a layer is not visible because of the map scale, its name and symbol will appear in very light gray. When you change the scale, these colors will become darker, indicating that the layer appears in the map if its display is enabled.
This manual is for developers who want to use JMap NG to create map visualization applications for the web, integrate mapping capabilities into their web applications or extend existing JMap NG tools. JMap NG connects to your instance of JMap Server and opens JMap projects.
Depending on the needs, one of two different approaches may be selected: using JMap NG Core or using JMap NG App.
Both JMap NG Core and JMap NG App can be easily embedded in you web applications or web sites. This manual explains how to do it and provides running examples that you can use to get started.
JMap NG Core is a library for building map visualization applications for the web. It connects to a JMap Server instance to load and display a map project. It is based on the open source project. It does not include any UI except for the mouseover popups and basic map controls. It is useful when you need only the map but want to build your own UI around it.
JMap NG Core provides a JavaScript API to perform simple tasks and JMap related tasks like getting a JMap Project, managing layers and accessing feature attributes. It also exposes the full MapLibre GL JS API for other tasks.
The latest version of the JMap NG Core Javascript API documentation is available .
JMap NG App is a complete map visualization application based on JMap NG Core. It provides a complete UI with many ready to use tools such as measuring, selecting, editing features, printing. It does not require any programming but provides a JavaScript API and can be extended by writing JMap NG extensions. JMap NG extensions are modules that plug easily into JMap NG to extend its capabilities, perform custom tasks or to support the integration of JMap NG into another web application.
The latest version JMap NG App Javascript API documentation is available .
This function allows you to filter the data source elements that are part of the layer. This allows you to create multiple different data layers using the same data source.
SQL conditions are used to filter the data source elements. Only elements that meet the SQL conditions will appear on the layer.
The Filters section, accessible by clicking on , allows you to configure the SQL conditions.
equals: This operator filters DS elements to conserve in the layer the elements whose attribute value (regardless of its type) is equal to one of the selected values.
does not equal: This operator filters DS elements to conserve in the layer the elements whose attribute value (regardless of its type) is different from the selected values.
greater than: This operator filters DS elements to conserve in the layer the elements whose attribute value (numeric or date) is greater than the selected value.
greater or equal to: This operator filters DS elements to conserve in the layer the elements whose attribute value (numeric or date) is greater than or equal to the selected value.
less than: This operator filters DS elements to conserve in the layer the elements whose attribute value (numeric or date) is less than the selected value.
less or equal to: This operator filters DS elements to conserve in the layer the elements whose attribute value (numeric or date) is less than or equal to the selected value.
contains: This operator filters DS elements to conserve in the layer the elements whose attribute value (text) contains the selected value.
does not contain: This operator filters DS elements to conserve in the layer the elements whose attribute value (text) does not contain the selected value. This is the same as making a query with the WHERE clause attribute_name NOT LIKE '%value%'.
is null: This operator filters DS elements to conserve in the layer the elements whose attribute value (regardless of its type) is null.
is not null: This operator filters DS elements to conserve in the layer the elements whose attribute value (regardless of its type) is not null.
is between: This operator filters DS elements to conserve in the layer the elements whose attribute value (numeric or date) is within the range defined by the two entered values.
is not between: This operator filters DS elements to conserve in the layer the elements whose attribute value (numeric or date) is not within the range defined by the two entered values.
You can access several functions from a data source's menu : view its information, edit its configuration, update the data, manage permissions, or delete the source.
The following sections provide detailed descriptions of each function.


1
Click + to add a SQL condition.
2
Condition components: Attribute : Select the attribute from the drop-down list. All attributes of the DS are available. Operator : Select the operator from the drop-down list. Operators vary depending on the type of attribute selected (text, integer, double, date). The Filter operators section describes each of them. Value : Enter the attribute value that will be used to filter the elements.
3
You can add a SQL condition, update it by changing its components, or delete it.


JMap Cloud allows you to create data sources (DS) from CSV files containing tabular data without spatial components. These datasets can later be linked to spatial data if needed.
Files can be uploaded during the data source creation process, or uploaded in advance via the file management interface. For more information, refer to the Uploading Files section.
Steps to Create a DS from a Tabular File
Upload the CSV file to JMap Cloud.
Metadata analysis (structure, data types, etc.).
Validation and configuration of the DS parameters.
Once the process is complete, both the data and its configuration are stored in JMap Cloud’s databases.
In the Data Sources tab, click on Create a data source.
Select the Tabular data file (non spatial) option.
Choose between:
New File: to upload a file from your local device.
Existing File: to select a file already stored on JMap Cloud. For more details, refer to the Uploading Files section.
Uploading
If you choose New File, go to the corresponding tab and select the file to upload. Only one CSV file, compressed as a .zip, can be uploaded.
If you select Existing File, choose the desired file from those already available in JMap Cloud.
Configuring DS Parameters
When uploading a new file, JMap Cloud automatically analyzes its metadata (format, structure, data types, etc.) before displaying the configuration window.
If you choose an existing file, the analysis has already been completed and the configuration window opens immediately.
For details on the configurable options, refer to the File settings section.
You may also add a description and tags to help filter and organize your data sources. To create new tags, simply type them into the Tags field.
Finalizing the DS
Click Create to launch the process. The new data source will appear in the list. Its status will first display as Preparing, then switch to Ready once the process is complete.
The uploaded files appear in the Files tab. These files are automatically deleted from JMap Cloud after 10 days.
The table shows the general settings to configure when creating an DS from tabular data files.
Name
Give the DS a name. There are no restrictions for the name of resources (DS, projects, map layers) in JMap Cloud.
Description
Optional. You can add a description of the data source.
Unique identifier
Optional. Select the field that contains the unique identifier of each table register. This identifier is necessary when you want to establish links with other data sources.
Tags
Optional. You can add labels that can be used to sort or filter DS. Tags are available for use with all resources (DS, projects, layers).
Fields
The fields in the file are presented in a table that contains the name and data type of each field.
The following pages contain source code examples that you can run or modifiy in Codepen.io.
In all examples, you must import the JMap NG core or app library from our CDN with a command like this:
<script defer type="text/javascript" src="https://cdn.jsdelivr.net/npm/jmap-core-js@7_Kathmandu_HF3"></script>or
<script defer type="text/javascript" src="https://cdn.jsdelivr.net/npm/jmap-app-js@7_Kathmandu_HF3"></script>The specific version of the library that you import must match the version of your backend. For JMap Cloud, always use version 'jmapcloud'. For JMap Server, use the version that matches your setup (for instance, 7_Jakarta_HF6 or 7_Kathmandu_HF3). New versions of JMap NG libraries are published for each release of JMap Server.
Project data is organized into layers. Each layer contains data related to a specific theme. Layers are superimposed on one another to form the map that is displayed in the interface.
Some layers are comprised of objects or elements that are represented using a type of geometry (points, lines, polygons) and descriptive attributes. For example, a layer can represent trees using points, and the attributes associated with them can include the species of tree, diameter, height, and state of health. Thus, each object (tree) of the layer has a geometry that is located in space and attributes that describe it.
Other layers are comprised of raster data (pixels) that form images, such as aerial photographs, satellite images or digital elevation models.
Layers can be grouped hierarchically based on themes, such as urban planning, the environment, transportation, etc. A multi-level hierarchical structure makes it easier to work with projects when they contain many layers and different themes.
Some layers are called base maps because they provide a context to display the data layers. Interaction with base maps is limited to selecting the base map to be displayed in the application.

Roles in JMap Cloud Portal define user categories, each associated with a set of access and editing privileges for an organization's resources.
Each member of an organization is assigned a single role, chosen from the following:
Administrator
Editor
Viewer
These roles determine which functions and sections of JMap Cloud Portal a user can access.
Only Administrators and Editors can log in to JMap Cloud Portal. Viewers interact solely with applications that display the data configured in the portal.
The following diagram illustrates the relationship between the roles:
The Administrator has full access to all functions in the portal and applications.
The Editor manages data and projects but has no administrative access.
The Viewer only uses the applications to view or interact with data, depending on granted permissions.
The Administrator is responsible for the administrative management of the organization within JMap Cloud Portal, including user management, API keys, and organizational settings.
The Administrator can:
Create, modify, and delete API keys
Configure organization settings
Invite new members
Assign and modify user roles
Create, edit, and remove organization members
Manage the organization’s extensions
These functions are accessed through the Organization section. The chapter Managing the Organization provides further details.
From the Dashboard, the Administrator can also quickly create API keys.
Additionally, the Administrator has all the privileges of the Editor role.
The Editor is the default role for organization members.
Editors do not have access to administrative functions but are responsible for setting up and configuring projects that are shared through JMap Cloud applications.
The Editor can:
Create, configure, modify, and delete the following resources:
Data sources
Projects
Map layers and non-spatial data tables
These tasks are performed through the Dashboard, Data Sources, and Projects sections of the portal.
The Viewer is an end user who accesses project data via JMap Cloud applications. This user does not access JMap Cloud Portal.
The Viewer can:
Access a project and its data
Navigate the map and interact with data (e.g., selecting features, viewing details, etc.)
If granted appropriate permissions, edit geometries and/or attribute values of a layer or table
The table presents the different statuses that can have a spatial data source.
Uploading
Files only. The file is being uploaded to JMap Cloud.
Analyzing
Files only. The file is being analyzed. JMap Cloud detects file characteristics such as file type, CRS, attributes, etc.
Analyzed
Files only. The file has been analyzed and its characteristics must be validated by you.
Preparing
Files only. Once the file characteristics have been validated and the data source parameters have been completed, the data is loaded into the JMap Cloud databases.
Processing
The data source is being updated.
Ready
The spatial data source is ready to use.
Error
Indicates an error in one of the steps of creating or updating the DS. Through the menu you can update the SD to fix the error.
Web Map Service (WMS) and Web Map Tile Service (WMTS) are two standards defined by the Open Geospatial Consortium (OGC). They specify how client applications should send requests to obtain maps from compatible servers.
WMS servers use the HTTP protocol to return map images in common raster formats such as PNG, JPEG, or GIF.
Server capabilities are described in an XML document that outlines the supported request types, available layers, supported projections, and other metadata.
WMTS servers, on the other hand, deliver maps as predefined tiles, enabling faster and more efficient rendering, particularly for large-scale navigation.
JMap Cloud can query servers that comply with either the WMS or WMTS standard to create spatial data sources, allowing you to integrate external map layers into your projects.
The settings you need to complete are as follows:
Name
Give the DS a name. There are no restrictions for the name of resources (DS, projects, map layers) in JMap Cloud.
GetCapabilities URL
Enter the GetCapabilities URL which will return the capabilities of the WMS or WMTS server. The URL must use the https:// protocol, otherwise an error message is displayed. The URL should look like this: For a WMS compatible server: https://www.server.com/wms?SERVICE=WMS&VERSION=1.3.0&REQUEST=GetCapabilities
For a WMTS compatible server:
Description
Optional. You can add a description of the data source.
Tags
Optional. You can add labels that can be used to sort or filter DS. You can create them by writing text in the box. Tags are available for use with all resources (DS, projects, layers).
This section allows you to create and send invitations to individuals so they can join your organization on JMap Cloud Portal.
A table lists all invitations sent from this tab or from the Members tab. For each invitation, the following details are displayed:
Invitation ID
Sender’s email address
Recipient’s email address
Creation date
Expiration date
A menu at the far right of each row allows you to view details or delete the invitation.
A second menu in each column header allows you to sort, filter, hide, or show attributes as needed.
This feature is also available from the Members tab.
To invite a new member to the organization:
Click + Invite member.
Enter the recipient’s email address.
Select the role to assign (Administrator, Editor, or Viewer) and, if needed, the groups the member will belong to.
Choose the correspondence language (the language of the invitation email).
Click Create.
A confirmation window will appear. You may copy the invitation link to your clipboard by clicking the icon.
Close the window. The invitation will now appear in the invitations table.
To access these actions:
Click the menu at the right of the desired row.
Select Display info to open a window showing:
The invitee’s email address
The sender’s email address
The creation and expiration dates
The correspondence language
The assigned role and groups
The invitation link, which can be copied
Select Delete to invalidate the invitation. The invitee will no longer be able to use the link to join JMap Cloud Portal.
The invited member receives an email from JMap Cloud inviting them to join your organization. The email includes:
The name of the person who sent the invitation
The email address of the invitee
The name of the organization
A clickable invitation link
A call-to-action link titled Accept the invitation
By clicking either the link or the Accept the invitation button, the invitee is taken to the Accept invitation to register | Porta page, where they can set a password and log in for the first time to JMap Cloud Portal.
If the member is assigned the Administrator or Editor role, they will have access to JMap Cloud Portal.
If they are assigned the Viewer role, once logged in, they will access the projects for which they have permission via the JMap NG mapping application.
This section displays a table of the organization's members, along with a button to invite new members to JMap Cloud Portal.
For each member, the table shows the following information:
Name
Identifier
Email address
Role
Groups the member belongs to
A contextual menu appears when hovering over a member’s name. It provides options such as viewing details, editing, or deleting the member.
Another menu , located in the header of each column, allows you to sort, filter, hide, or show table attributes.
To invite someone to join your organization on JMap Cloud Portal:
Click Invite Member.
Enter the person's email address.
Select the role and groups from the dropdown lists.
Choose the language for the invitation email.
Click Create. A confirmation message will indicate that an invitation email has been sent.
To copy the invitation link, click the icon.
Close the window. The invitation will appear under the Invitations tab.
Hover over the member's name and click the contextual menu .
Select Display info to open a window displaying the member’s name, email, role, and groups.
Click Edit to change the member’s role or groups.
Save the changes — the updates will take effect immediately.
Members with the Administrator or Editor role may own resources such as files, data sources, projects, and map layers.
When such a member is deleted, an administrator must decide what to do with their resources.
Steps to delete a member:
Click Delete, the following message is displayed.
To keep the member’s resources, check Transfer ownership to, then choose another member from the dropdown list.
Click Delete to confirm.
The deleted member’s access permissions (ACL entries) will be removed.
The selected member will become the new owner of the resources.
You may also choose to delete the member without transferring ownership:
The member and their resources (including any dependencies) will be permanently deleted.
All associated access permissions will be removed.
Member deletion is permanent and irreversible.
The member will no longer be able to access JMap Cloud Portal.
They are physically removed from the organization’s identity manager.
To display the geographic extent of a layer, even if it is not displayed in the map:
Click on and then on Zoom to layer extent. The map automatically displays the area corresponding to the extent of the layer. A rectangle delimiting the extent of the data is displayed for a few moments.
Click on if you wish to return to the previous geographic extent.
JMap NG is accessible from a web browser (Edge, Google Chrome, Firefox, Safari, etc.) through an invitation link sent by your organization.
The following image shows JMap NG's login interface.
The login interface and the application itself are displayed in the language you configured for your web browser.
Click on located at the bottom of the interface to display the available languages and change the display language of JMap NG.
The version of JMap NG as well as the JMap product to which the application is connected are also displayed at the bottom of the interface.
If access to the application is controlled, sign in with the username given by your organization and choose a password.
Once you are logged into the application, the following interface allows you to select the project you wish to access. The projects you have permission to access will be displayed.
Use the filter to more quickly identify the project that interests you.
Click on a project to access it.
Click on to open the menu providing access to the documentation and allowing you to log out of your JMap NG session.
You can delete a layer or group of layers from the project:
Hover over the group or layer you want to delete until its icons appear.
Click the Delete icon. The layer disappears from the Layers section and the map. The group disappears from the Layers section, and its component layers appear in the same location as the group in the Layers section.
To perform some functions such as interactively selecting elements of a layer using the selection tools, you must first make the elements of the layer selectable.
Pass the cursor over the card of the layer you are interested in to display the icon .
Click on to make the layer elements selectable. The icon is permanently displayed in the form.
Click on to make the elements of the layer non-selectable. The icon stops displaying and when you pass the cursor over the card, the icon appears.
Labels are text elements attached to map features. They are used to display information about it. For example, you can use labels to display city names for a point layer representing cities.
The Labels section, accessible via the icon, allows you to configure the content, style, and display of labels for the layer's elements.
Labeling is configured by specifying text that defines the label's content. Label text can span multiple lines.
The text can contain static and variable parts, such as functions. When displayed, the functions are executed and replaced with the result. Labels don't support HTML formatting or hyperlinks.
The following functions are available:
The available attributes are displayed in the Attributes section.
To enter the label content:
Write the text for static content.
If you want to include dynamic content, position the cursor at the desired location within the content area and click to select the function you want to use. It is instantly added to the content area, and a menu of available attributes for the function is also displayed.
Select the attribute and add a value if applicable.
Click to save the label content.
To view the information for a data source (DS), open the menu associated with the desired DS and select View Information. The interface consists of two tabs: Information and Attributes.
This tab displays general details about the data source:
Name and description
References: projects, layers, and/or tables using this data source
Associated tags
For spatial DS, an interactive map is displayed:
A dotted outline indicates the geographic extent of the DS
The base map is provided by OpenStreetMap
Features are loaded progressively, up to a maximum of 50,000 elements. Any elements beyond this limit are not displayed
Digital Elevation Models (DEM) from GeoTIFF files are shown in grayscale
Additional technical information is also displayed:
DS identifier (click to copy to clipboard)
Unique identifier within JMap Cloud
Coordinate Reference System (CRS)
Total number of elements in the DS
For tabular DS, a navigable data table is shown, along with:
The number of loaded rows
The total number of records in the table
This tab lists all attributes (or fields) of the DS. For each attribute, three sections are available:
Settings: title, data type, and indexing status
Statistics: value statistics (depending on the attribute type)
Value Domain: displays the current domain (if any), or allows you to create one
A value domain defines the valid set (finite or infinite) of values that an attribute can take—typically for text or numeric fields.
To create a value domain:
Click Create Value Domain
The Value and Label columns appear
Click + to add a row
Enter the value and its label
Click to save or to cancel
Repeat to add additional values
You can:
Remove individual values by clicking the icon
Delete the entire domain by clicking Delete Value Domain
You can modify some parameters:
If you have edit permissions for the DS, when you hover over the Description, Labels, and Unique identifier (SDS) parameters, the icon appears, allowing you to edit the parameter.
Also, if you have edit permissions, you can edit attribute/field titles, index them (by checking the box Indexed), and create, modify, or delete a value domain for text or quantitative attributes.
Press or to save or discard changes.
If you have editing permissions on the DS, you can modify certain parameters directly in the interface:
Hovering over the Description, Tags, or Unique Identifier (for spatial DS) displays the icon, allowing you to make edits
You can also:
Edit attribute titles
Toggle indexing
Create, modify, or delete value domains (for text or numeric attributes)
Click to save or to cancel your changes.
The JMap Cloud Portal user interface looks like this:
The JMap Cloud Portal interface organizes information into sections, typically displayed in table view, and occasionally in card view, depending on the resource type.
In table view:
Each row represents a resource, such as an organization member, API key, file, task, spatial data source, etc.
You can choose to display 25, 50, or 100 rows per page.
If the number of entries exceeds the selected limit, the table is paginated.
The footer displays the number of rows shown on the current page, as well as the total number of entries in the table.
Each column in the table represents a resource attribute, with the column header showing the attribute name.
A column options menu (⋮ icon) is available by hovering over each header, providing actions such as:
Sort rows (ascending or descending)
Filter rows based on a specific attribute value. When a filter is active, a icon appears next to the attribute name.
Hide column
Show hidden columns
And other attribute-specific options
Some sections, such as Projects, also offer a card view, providing a more visual layout of the resources and their key information.
A contextual menu ( icon) is available:
In the Name column when hovering over a row in table view.
Or directly on each card in card view.
Menu options vary depending on the resource but may include:
View information
Edit information
Create data source
Interrupt
Delete
And other relevant actions
Each section—except for Jobs—includes a button to add new resources.
All dates are displayed using the ISO 8601 format (e.g., 2025-06-18T14:30:00Z).
Form components are typically associated with an attribute or field from the data source, except for the Label component, which is not data-bound.
The following sections describe:
the types of components available in JMap Cloud Portal,
the parameters specific to each component type,
and the various features for managing components within a form.
JMap Cloud Portal offers a variety of component types to meet different functional and visual requirements within forms.
Each component type includes specific parameters that control its behavior and appearance (e.g., default text, formatting, style, constraints, etc.).
To add a component to a form, drag it from the palette and drop it into the Design tab interface. Components can be placed within .
To configure a component already placed in the form, click on it in the Design tab. Its editable parameters will appear in the Properties section.
You can adjust the spatial arrangement of components using the layout tools described in the following section.
To delete a component, click on it in the Design tab, then click the delete icon .
Popups are used to display information about the highlighted elements. This information includes text, attribute values, hyperlinks, images, etc.
You determine the information displayed in the popups for each layer.
The Popups section, accessible via the icon, allows you to configure the content and display of the popups.
The popup content is configured by specifying text that can contain static and variable parts, such as functions. When displayed, the functions are executed and replaced with the result.
Follow the available functions for popups:
The available attributes are displayed in the Attributes section.
To enter the popup content:
Enter the text for the static content.
If you want to integrate dynamic content, position the cursor at the desired location within the content area and click to select the function you want to use. It is instantly added to the content area, and a menu of available attributes for the function is displayed.
Select the attribute and add a value if applicable.
Click to save the popup content.
Several tools allow you to navigate the map.
This feature is only available when a Mapbox API key is configured. Contact your JMap administrator for more details.
You can search for a specific place in the map:
Press to open the box and write location information.
Enter search terms. You can enter an address, a postal code, a city name, a place, etc. JMap NG uses the Mapbox Geocoding service to find the location. As you enter information, places with matching information are displayed.
Select the desired location by clicking on it. The map zooms and centers on the place identified by a mark . Location information is displayed in a tooltip.
When you search for another location, the mark of the previously selected location disappears.
Press to close the place search and clear the last place information.
Press to close the search and erase the information of the last location.
You can search for an feature in the project based on the value of one of its attributes.
Press or press / to open the Search on the project box.
Enter the search terms. As you enter terms in a list, elements in the project layers whose attribute value matches the terms you enter are displayed.
Click the list the element you want to find. The map centers on the element which is selected.
Click the layer name to select all features in the layer whose attribute value matches the terms you enter. The map centers on them.
You can navigate on the map using your fingers or the pointer:
Using your fingers you can zoom in and out, move the map, and tilt it to navigate on it in 3D, as shown in the figure below.
Click on the icon to display map rotation information (in degrees, with North as a reference) and map inclination information (in degrees, based on the horizontal plane).
Click on the icon to straighten the map, eliminating the rotation and tilting of the map. The icon turns gray and indicates the North on the horizontal plane .
You can center the map at a specific coordinate and change the map scale:
Press to open the geographic information window.
Press Scale to open the Change the map scale window.
Enter the new scale or select it using the arrows. The scale of the map changes as you change the numbers.
Press OK to close the window. The map is displayed at the scale you have chosen.
Press the Latitude and Longitude (Lat Lon) data to open the Recenter the map window.
Enter the new Latitude and / or Longitude or select them using the arrows. The map automatically recenters at the chosen coordinate.
Press OK to close the window.
Dashboard is the home section of JMap Cloud Portal. As its name implies, it provides a real‑time overview of key resources—such as projects and data sources—and even lets you create new ones directly from this view.
Extensions are plug-ins for JMap NG App that extend its functionalities. With the JMap NG API, you can develop your own extensions.
Extensions can add their own UI, typically an icon and a side panel. It is possible to have extensions with a different UI and even with no UI at all.
NG Extensions are javascript objects that respect an interface (either or ) and that are loaded by NG at application startup or project load, depending on the type of the extension. Every extension must have a unique id property, a initFn implementation, if implementing , and a onPanelCreation implementation if implementing .
Extension life cycle
Extensions are being "registered" by NG in 2 different ways:
if included in the JMap NG , they will be automatically registered by NG.
If loaded from a javascript <script> tag or via a project load, the extension must register itself. This is typically done in the extension "entry point" by calling the method, for a Core extension, or method, for an Application extension.
The registering process most importantly includes incorporating your extension's redux reducers, if provided, your translation bundle, if provided, and the extension service to expose, if provided.
When NG registers your extension, it automatically calls your extension's initFn and onPanelCreation methods. In your initFn or onPanelCreation method, you can handle all your extension's initializing process. Once the initFn method is called, you can start calling NG's API to communicate with it.
Extension unique ID
The Extension Unique ID serves a dual purpose for NG: it used by NG to identifiy and manage the loading process of extensions, while also establishing a connection with a server-side extension. This connection can link your extension to specific JMap projects, optionally allowing for the transmission of configuration data to your extension during project loading. The nature of your unique id thus depends on your way of deploying it.
How to deploy your extension
Once your extension is ready to deploy, you can compile it and host it on any CDN of your choice. If your extension is loaded via a project, the URL of your CDN will be configured in the server-side part of your extension. If you include your extension as a <script> tag in an HTML page, you will be able to use the CDN's url. In all cases, this url should always be accessible from the location where NG will run.
You can see a full extension example .
You can open the project in Studio, the section of the JMap Cloud Portal that provides tools for creating and configuring project layers and data:
Click and then Open in Studio. The section provides topic details.
You can set the initial extent of the project, that is, the geographic extent of the project that appears when opened in an application such as JMap NG as well as in Studio.
Activate the tool by clicking the icon in the Define an initial extent section.
Click once to begin, draw the rectangle, and click a second time to finish.
Click the accept icon to save the rectangle.

Label
Static text to be displayed as is in the form.
Text
Input field for an alphanumeric value. The associated attribute or field must be of type Text or Number.
Number
Input field for a numeric value. The associated attribute or field must be of type Number.
Boolean
Allows you to fill in the attribute or associated field for which there are only 2 possible values, true and false.
Date
Allows you to select a date. The attribute or field must be of type Date.
List
List of values from which, depending on the configured setting, only one value (single choice) or multiple values (multiple choice) can be selected. The associated attribute or field must be alphanumeric or numeric and have a finite number of values.
Attribute
Select the layer attribute or table field that the component is associated with. This is the attribute or field that the form component will populate.
Title
Give the attribute or field a title.
Default value
Enter or select a default value to initialize the input field.
Choice
List component. Select the list type: single choice or multiple choice.
Display
Select the display type for the component in the form. Text: Single line or Multiple line. List: Radio button or Selection. Boolean: Checkbox or Switch. Number: Input field or Slider.
Value domain
List component. This section allows you to view the attribute's value domain. If you want to edit the values, click Show value domain to open the data source attributes tab interface. You can then edit the values. If the attribute does not have a value domain, the Create value domain button appears, and when you click it, the data source attributes tab interface appears, allowing you to create the value domain.
Minimum
Component Number. Enter the minimum value for the attribute.
Maximum
Component Number. Enter the maximum value for the attribute.
Checked value
Boolean component. Specify the value to save when the box is checked or the switch is ON.
Unchecked value
Boolean component. Specify the value to save when the box is unchecked or the switch is OUT.
Status - Required
Determines whether the field is required. The user will not be able to submit the form until all required fields are completed. Required fields are marked with an asterisk (*) in the form designer.
Status - Read only
Enable this option to make the component read-only. The user will not be able to edit the content. This option should be used for a component with a default value.
1
Check this box to display popups.
2
Area for entering the popup content. The Popup content section provides details on this topic.
3
Available attributes for the popup. These are the layer attributes that you select in the Properties section.
4
Available popup functions. The Popup content section provides details on this topic.
5
Zoom levels. Zoom level threshold at which labels are displayed. Select the threshold by dragging the indicators on the bar or by entering the minimum and maximum zoom values for the range.
centroid()
Replaced by the coordinates of the geometric centroid of the element's geometry.
date()
Replaced by the current date and time.
elementId()
Replaced by the element identifier.
encode(attrib, encoding) attrib : the name of the attribute to encode encoding : the name of the encoding
Replaced by the value of the attrib attribute once it is encoded with the specified character encoding (UTF-8, CP437, ISO 8859-1, etc).
Example
encode(name, UTF-8)
Replaced by the value of the name attribute encoded in UTF-8 characters.
ev(attrib) attrib : the name of an attribute
This function is replaced by the value of the bound attribute whose name is passed as a parameter for the pointed element.
Example
ev(id)
Label displays the value of the id attribute for this element.
format(attrib, format) attrib: the name of a date or numerical attribute format: the desired date format
Replaced by a number or date that was formatted according to a specific format.
Example
format(date_insp, dd/MM/yyyy)
where date_insp is the name of an attribute containing a date and dd/MM/yyyy is the desired date format, as indicated in the documentation of the java.text.SimpleDateFormat Java class.
Example
format(attrib, ##0,00)
where attrib is the name of an attribute containing a number and ##0,00 is the desired number format, as indicated in the documentation of the java.text.DecimalFormat Java class.
ifNull(attrib, value) attrib : the name of the attribute to test value : the value to display if attrib is null
This function is replaced by the value value only if the value of the attrib attribute is null.
If the attribute value is not null, nothing is displayed.
Example
ifNull(temp, N/A)
Displays N/A if the value of the temp attribute is null.
Example
ifNull(attrib_a, attrib_b)
Displays the value of the attrib_b attribute if the value of the attrib_aattribute is null.
ifNotNull(attrib, value) attrib : the name of the attribute to test value : the value to display if attrib is not null
This function is replaced by the value value only if the value of the attrib attribute is not null.
If the attribute value is null, nothing is displayed.
Example
ifNotNull(land_value, $)
Displays $ only if the value of land_value is not null.
lineLength()
This function is replaced by the length of a pointed line type element.
polygonArea()
This function is replaced by the area of a pointed polygon type element.
projectName()
This function is replaced by the name of the current project.
subString(attrib, startIx, endIx) attrib: the name of the attribute for which a part must be extracted. startIx: starting position in the character string. endIx: ending position in the character string.
This function is replaced by a portion of the value (as a character string) of the attrib attribute, between the startIx position and endIx position.
Example
subString(name, 0, 5)
Replaced by the first five characters of the name attribute value. If this value is Montreal, the mouseover will display Montr.
userName()
This function is replaced by the user code of the user that is currently connected.


In this example, we will show how to add an event on move end in JMap NG.
We add an event to display the current center of the map. The value is updated each time the move ends.
Try it out in Codepen.io
<html>
<head>
<meta http-equiv="Content-Type" content="text/html;charset=UTF-8">
<meta charset="UTF-8">
<style>
#my-custom-map {
width: 600px;
height: 600px;
border: 1px solid grey;
margin-top: 1rem;
}
</style>
</head>
<body>
<label><b>Center of the displayed map: </b></label>
<br/>
<label>Latitude: </label>
<span id="latitude"></span>
<br/>
<label>Longitude: </label>
<span id="longitude"></span>
<div id="my-custom-map" class="jmap_wrapper"></div>
<script type="text/javascript">
window.JMAP_OPTIONS = {
projectId: 1,
restBaseUrl: "https://jmapdoc.jmaponline.net/services/rest/v2.0",
anonymous: true,
map: {
containerId: "my-custom-map",
zoom: 13.797865986918877,
center: {
x: -73.48063889179525,
y: 45.664231577062765
},
onStartupMapReadyFn: () => {
const initialCenter = JMap.Map.getMap().getCenter()
document.getElementById("latitude").textContent = initialCenter.lat
document.getElementById("longitude").textContent = initialCenter.lng
JMap.Event.Map.on.moveEnd("move-end", (params) => {
const center = params.map.getCenter()
document.getElementById("latitude").textContent = center.lat
document.getElementById("longitude").textContent = center.lng
})
}
},
};
</script>
<script defer type="text/javascript" src="https://cdn.jsdelivr.net/npm/jmap-core-js@jmap-ng-doc"></script>
</body>
</html>1
Font Click this button to select the label text style: font size, bold, italic, font color, outline, and outline color.
2
Activate labels Check this box to display labels by default in JMap NG.
3
Area for writing the label content. The Label content section provides details on this topic.
4
Attributes Available attributes for labels. These are the layer attributes that you select in the Layer Properties section.
5
Functions
Functions available for labels. The Label content section details these functions.
6
Zoom levels Zoom level threshold at which labels are displayed. Select the threshold by dragging the indicators on the bar or by entering the minimum and maximum zoom values for the range.
7
Position Determine the position of the label relative to the element. Click to select the position from the nine possible options. Allow overlapping
Check the box to allow the labels of the layer to overlap the labels of other layers. This can be useful to ensure that all labels of this layer are displayed. Follow the line Only for line elements. Check the box to display the label text along the lines. Spacing (pixels) Only for line elements. Set the labels spacing (in pixels) along the lines.
8
Offset (pixel) Set the offset in pixels and on both dimensions of the label's position relative to the element.
9
Frame Check the box to add a frame to the label text. Select the background and countour color for the frame.
10
Rotation If you check Rotation using an attribute, select the numeric attribute whose values will be used as the rotation angle and the rotation direction. If you check Follow map rotation, labels will follow the map rotation.
11
Proportional size By default, label text is always displayed at the specified font size, independently of the zoom level of the map. Check this option to have the label text size adjusted proportionally to the zoom level of the map. Drag the point in the bar to select the reference zoom level at which text is displayed at the specified font size. When the zoom level of the map changes, the text size is modified accordingly.
12
Click on the language of your choice to enter the label content in the selected language.
ev(attrib) attrib : the name of an attribute
This function is replaced by the value of the bound attribute whose name is passed as a parameter for the pointed element.
Example
ev(id)
Label displays the value of the id attribute for this element.
ifNull(attrib, value) attrib : the name of the attribute to test value : the value to display if attrib is null
This function is replaced by the value value only if the value of the attrib attribute is null.
If the attribute value is not null, nothing is displayed.
Example
ifNull(temp, N/A)
Displays N/A if the value of the temp attribute is null.
Example
ifNull(attrib_a, attrib_b)
Displays the value of the attrib_b attribute if the value of the attrib_aattribute is null.
ifNotNull(attrib, value) attrib : the name of the attribute to test value : the value to display if attrib is not null
This function is replaced by the value value only if the value of the attrib attribute is not null.
If the attribute value is null, nothing is displayed.
Example
ifNotNull(land_value, $)
Displays $ only if the value of land_value is not null.

1
Header bar. Indicates the section of JMap Cloud Portal that is displayed in the main interface. Icons allow you to change language and graphical interface settings. Information of the logged in user as well as functions to change password and log out.
2
Tools bar. Each icon provides access to a section:
Dashboard: provides an overview of the organization's resources to which you have access.
Organization: contains the functions that allow you to manage the administrative aspects of the organization: members, invitations, etc.
Data Sources: Introduces functions to create and manage the spatial data sources you have access to.
Projects: contains functions for creating and managing projects.
Forms: contains functions for creating and managing forms.
Jobs: contains tasks performed by JMap Cloud Portal.
Icons are enabled or disabled based on the role of the logged in user. See the Roles section for more details.
3
Access to JMap Cloud Portal documentation.
4
Section interface.

1
Projects card displays the number of projects to which you have access, either because you are the owner or because you have access permissions. You can create a new project by pressing .
2
Data Sources card displays the number of data sources to which you have access, either because you are the owner or because you have access permissions.
3
Usage displays the organization's data volume. Only members with the Administrator role see this card.
4
API Keys card displays the number of API keys configured by your organization. Only members with the Administrator role view this card. You can create a new API key by clicking on .
As the owner of a data source (DS), you can grant access permissions to other users within your organization.
Permissions can be assigned to:
Groups;
API keys.
Each role has different levels of access.
Editor
Owner
This permission, the broadest, allows the user to:
grant access permissions to members of the organization,
delete the DS.
The SDS must have at least one owner.
Editor
Modify
This permission allows the user to modify the DS settings.
Viewer
View
For the user with the VIEWER role, this permission, combined with the Extract Features permission, allows the user to view SDS data in a cartographic application (such as JMap NG). For a user with the EDITOR role, this permission allows the use to view the DS in JMap Cloud Portal and use it in projects.
Viewer
Extract Features (Spatial DS) This permission allows the user to extract features from the SDS and, combined with the View permission, allows to view SDS features in a cartographic application (such as JMap NG). Extract Data (Non spatial DS) This permission allows the user to extract data from the DS and, combined with the View permission, allows to view DS data in a cartographic application (such as JMap NG).
Viewer
Create Features (Spatial DS) This permission allows the user to create features in the SDS in a cartographic application (such as JMap NG). Insert Data (Non spatial DS) This permission allows the user to insert data to the DS in a cartographic application (such as JMap NG).
Viewer
Edit Geometries (Spatial DS) This permission allows the user to edit the geometry of SDS features in a cartographic application (such as JMap NG)
Viewer
Edit Attributes (Spatial DS) This permission allows the user to edit the attributes of SDS features in a cartographic application (such as JMap NG). Update data (Non spatial DS) This permission allows the user to modify the values of DS fields in a cartographic application (such as JMap NG).
Viewer
Delete Features (Spatial DS) This permission allows the user to delete features from the SDS in a cartographic application (such as JMap NG). Delete data (Non spatial DS) This permission allows the user to delete data from the DS in a cartographic application (such as JMap NG).
Permissions follow a hierarchical structure:
Owner includes both Edit and View permissions;
Edit automatically includes View;
Viewer role-based permissions are at the base of the hierarchy and always include View.
Steps to grant permissions:
Click the icon next to a DS, then select Permissions. The permissions management interface will open, displaying:
the name of the DS;
the list of members, groups, and API keys with their current permissions.
To add a new recipient:
Open the dropdown list in the Add a member field;
Select a member, group, or API key (one at a time). The selected name appears with a letter indicating their role. You can clear a selection using the ✕ icon if needed.
Click to include the recipient in the permissions list.
Check the boxes to assign the appropriate permissions to each recipient.
Groups cannot be assigned the Owner permission.
You can at any time:
change existing permissions;
add new recipients;
remove all permissions from one or more members, groups, or API keys.
Steps to manage permissions:
Click , then select Permissions to open the configuration interface.
Check or uncheck the relevant boxes to update permissions.
A DS must always have at least one member with Owner permission.
To remove all permissions:
Start by unchecking the highest-level permission (e.g., Owner). The next level (e.g., Edit) becomes the highest active permission.
For Viewer-type permissions, you must first uncheck the specific sub-permissions before removing the general View right.
To delete members, groups, or API keys:
Check the box next to each name;
Click the icon to remove them from the list.
You can create a new project from the Dashboard or from the Projects section.
To create a new project:
Click Create a new project.
Complete the project settings.
The project displays in the Projects section. In both display modes, cardboard or list, the menu offers functions for managing projects.
Name
Enter a name for your new project. As with other JMap Cloud resources, the name does not need to be unique. Press the English button if you want to give the project name in another language (French or Spanish).
Default language
Among the available languages, select the one that will be used by default when the requested language is not available or translations are missing.
Public
Optional. Check this setting if you want to make the project public. If you do not check the box, the project is private. The section describes the details of project access. You must first complete the project creation procedure to then be able to make it public. When the box is checked, the icon is displayed to copy the URL of the JMap Cloud application that opens the project.
Map CRS
Select the map reference coordinate system. It determines how data is displayed in map applications. All data using a different projection is converted on the fly to that projection. The default CRS in JMap Cloud is EPSG:3857 - WGS 84 / Pseudo-Mercator, the most common for web mapping applications.
Map unit
Select the map unit. The mapping unit is automatically selected based on the selected CRS.
Display unit
Select the unit used to display map coordinates.
Measurement CRS
Select the coordinate reference system that will be used for calculating measurements. The default CRS is EPSG:4326 - WGS 84, latitude/longitude coordinate system used by global positioning systems (GPS). Distance and area measurements are made using spherical calculations based on the ellipsoid of the projection.
Measurement unit
Unit used to display measurements (distance, area, etc.).
Background color
Default background color of the map.
Selection color
Color of selected objects on the map. This parameter can also be defined for each layer.
Initial rotation
If you want to print a rotation to the map, enter the rotation value in degrees. The rotation is clockwise.
Description
Optional. Enter a description for the new project. This is useful for project management purposes.
Extensions
Optional. This section lists the extensions available for the project. Check the extension you want to add to your project.
Tags
Optional. Add tags that can be used to sort or filter projects. You can create them by writing the text in the range. Once created, they are available for use in all resources (DS, projects, layers). They appear when you enter label terms.
Vector tiles are a very effective vector data format for web mapping. The principle consists of dividing all of the vector data of a project into tiles, in a manner analogous to raster data tiles (WMTS).
There are several standards for producing vector tiles. Mapbox proposed a standard based on the Protocol buffers ("Protobuf") encoding created by Google (https://developers.google.com/protocol-buffers). Mapbox vector tiles (mvt) are supported by a wide range of mapping products including JMap Cloud, JMap Server and JMap NG.
A grid that defines the tiling is applied to the vector data which is then cut into tiles. Each tile can contain vector data from multiple layers.
A set of tiles is produced for each scale level. In web cartography in general, 23 scale levels are considered, level 0 corresponding to the Earth and level 22 corresponding to the street. The vectors of the lower levels are simplified (generalized) to optimize the display of data while keeping tiles of an efficient volume.
The vectors (lines, polygons) of each layer are cut at the tile boundaries. When geometries cross the border between tiles, the tiles are cut and each tile contains part of the geometry. It is the mapping application that unifies the vectors to obtain the complete geometry.
Attributes of map elements are included in the tiles. This makes the data more dynamic and interactive, allowing for example to display thematics created on the fly or to display data based on the application of filters based on their attributes.
The vector tiles therefore contain the geometries and their attributes, the styles are not included in the tiles. The information defining the styles is stored and managed in a separate JSON file. This feature allows application users to define styles dynamically because the applications manage the styles. Additionally, when the data style changes it is not necessary to generate new tiles.
The tiles can be created in advance and cached, the server response being much faster to requests from the web mapping application, which gives a very fluid and efficient rendering.
A JMap Cloud project generates three sets of data that are used by applications:
A JSON file containing style. This file accompanies the vector tiles. It contains the definition of each layer contained in the vector tiles, their style settings, themes, etc.
A set of vector tiles that contain the geometries and attributes of non-editable layers. JMap produces one mvt format file per tile. These tiles can be created on demand as users navigate JMap NG applications. They can also be created in advance and cached.
Vector data in GeoJSON that corresponds to the geometries and attributes of the editable layers. This data is sent on-demand by region to apps.
In general vector tiles are lighter than raster tiles but certain factors can affect the size of the tiles and have an impact on the performance of JMap NG applications. The size of the tiles is associated with the time of their production, the storage volume, the volume of data exchanged with the applications and the dedicated memory of the applications.
Among the factors to consider we can cite:
Number of attributes linked to layers: Attribute data influences the size of the tiles, which increases with the number of attributes.
Layer visibility scales: Setting visibility thresholds for layer display is appropriate when layers have very dense data. Limiting the display of these layers to larger scales is a good strategy because tiles at smaller scales will not contain data from these layers and tile production time will be reduced.
Caching: Producing and caching tiles in advance greatly improves application performance.
Pour gérer le cache de tuiles vectorielles du projet :
To manage the project's vector tile cache: Press to access functions. Tap MVT Cache to open the Manage MVT Tile Cache interface of the project. This interface has four sections:
Click and then on MVT Cache to open the Manage project's MVT tile cache interface. This interface has four sections:
Cache state
Indicates the cache status, if available.
Fill
This option allows you to indicate whether you want to create tiles for all 23 levels or for a specific range of levels. In this case, specify the minimum and maximum levels of the range. This option does not overwrite tiles that are already cached.
Delete
This option allows you to specify whether you want to remove tiles from all 23 levels or from a specific range of levels. In this case, indicate the minimum and maximum levels of the range.
Running task
Indicates the progress of the creation or deletion by cache level as well as the overall progress of the creation or deletion.
Indicate the task you want to perform.
Click Launch task. The Running task section displays task progress graphically and in percentage..
If you want to cancel the task, click . A message validates your choice.
You can grant permissions to other JMap Cloud members, groups or API keys in your organization for projects that you own.
Three permissions are offered. The permissions are hierarchical, in the sense that the broadest permission includes the other two permissions.
Groups cannot have Owner permission.
Owner
As the project owner you can grant this permission to a member of the organization who has at least the role. This permission, the broadest, allows the user to:
manage accessibility to the project, that is to say make it public or private,
grant access permissions to members of the organization,
delete the project.
The project must have at least one owner.
Modify
You can grant this permission to an organization member who has at least the role. This permission allows the user to:
modify the project settings with the exception of its accessibility.
View
You can grant this permission to a member of the organization who has the role. This permission allows the user to:
access the project via a mapping application (such as JMap NG) in which the user can view the data and edit the data of the editable layers.
To grant permissions to a project:
Click and then on Permissions. The permissions configuration interface opens displaying the members with the permissions each has. A letter indicates the member's role.
To grant permissions to a member, open the Add member drop-down list.
Select the members, groups or API keys you are interested in, one at a time. You can clear the selection by clicking . The names appear in the Add member field.
Once members are selected, click to add the members. These are displayed in the permissions table.
Check the permissions you want to grant to each member. The Owner permission automatically includes the other two permissions.
You can modify the permissions granted to members, grant permissions to new members, or remove all permissions from one or more members.
Click and then on Permissions. The permissions configuration interface opens displaying the members with the permissions each has.
Change the permissions by checking or unchecking the relevant boxes. To remove all permissions from a member group or API key, you must uncheck all three permissions. When you uncheck the Owner permission box, Modify automatically becomes the most important permission.
If you want to remove members, groups or API keys select them by checking the box to the left of each name and press .
Layers can have thematics, the appearance of that layer's elements vary based on one or more attributes.
You can display more than one thematic for a layer at the same time.
To display the THEMATIC(S) panel of the layer:
Click the layer icon. The THEMATIC(S) panel displays the legend of the thematics.
Use the switch to enable or disable each thematic. The appearance of the icons representing the layer's objects will change according to your choice.
You can uncheck one or more classes or categories of the thematic so as not to display on the map the elements of these classes.
If the JMap administrator has configured it in this way, the thematic legend can be dynamic, i.e. the legend only shows the classes or categories of the elements displayed in the map. The classes of elements that are not displayed in the map are not shown in the legend. As you navigate the map, the legend changes depending on what is displayed there.
Click on or to close or open the thematic's card.
Click on Back to return to the Layers panel.
This option is only available for layers that have thematics configured.
Click on and then on Thematic management to open the THEMATIC(S) panel and use the functions described in the previous section.
To display layer information:
Click on and then on More information to open the GENERAL panel. Several information are presented there:
Number of layer features that are visible on the map. The number varies as you navigate the map.
Extent: X and Y indicate the position of the southwest point of the layer, width and height indicate the layer extent in meters from this point.
Metadata: information about the data in the layer such as quality indicators, the organization producing the data, update dates, etc. Metadata may be missing.
The Transparency function, available for raster data layers, allows you to adjust the transparency level between 0% (default) and 100%.
Click on the THEMATIC(S) and/or FILTER(S) tabs to display these panels.
Click Back to return to the Layers panel.
The Profile and user settings panel offers some basic functionality to customize JMap NG's interface.
Click on to open the Profile and user settings panel.
Click on if you want to edit your name.
If you want to change the app password, open the Modify password menu.
Enter your current password.
Enter the new password.
Confirm the new password.
Click Change to save the new password.
Select the Theme of the application.
In the Distance unit drop-down menu, select the unit that will apply to the scale and the distance and area measurements.
Click on to display the available languages and change the application's language. The change can take a few moments because it may involve changing the language of the application and data (layer titles, attribute names, tooltip content, etc.).
Click on Logout if you wish to log out of the session. You will return to the JMap NG login interface.
Click on to close the Profile and user settings panel or on another icon in the sidebar to open another panel.
You can export the map in different formats to print it or insert it in various documents. The tools to configure the map for this purpose are found in the Exportation / Print panel.
The Exportation / Print panel contains the tools to configure the map.
Click on to open the Exportation / Print panel. The icon changes color .
Slide the map in order to have the area you wish to export displayed in the data frame.
Click Download to export the map into a file of the selected format. The name of the file is made up of the title of the map followed by the name of the project. The map image is high definition to ensure its high quality when printed.
1
Title Enter the title of the map. The title will appear in the map as you type it.
2
Subtitle Enter a subtitle for the map. It will appear in the map as you type it.
3
Paper format In the drop-down list, select the paper format of the map. The different formats are shown in the data frame in real time.
4
Scale Enter a scale. The map displays the chosen scale in real time. You can change the scale of the map directly in the map interface. The Scale field displays the scale values.
5
Orientation In the drop-down list, select the paper orientation: Portrait or Landscape. The map displays the selected option in real time.
6
File type In the drop-down list, select the type of file to which you want to export the map: png, jpeg, or pdf.
7
Date Select this option to display the date in the map.
8
North Select this option to display the north arrow in the map.
9
Scale Select this option to display the bar scale in the map.
10
Resolution Check the High resolution box if you want to get a high resolution file.
11
The data frame displayed in the center of the map interface represents the layout that will be exported. It is fixed, and its shape and dimensions vary based on the selected paper format and orientation.


JMap Cloud allows you to create spatial data sources (SDS) from various vector and raster file formats: CSV, KML, DXF, DWG, SHP, TAB, GeoPackage, FileGeoDatabase, GeoJSON, and GeoTIFF.
Files can be uploaded during the SDS creation process or uploaded in advance to JMap Cloud’s storage area. For more information, refer to the Uploading Files section.
Multiple Files and Continuous Maps
An SDS can include several vector or raster data files to form a seamless map. For instance, in CAD workflows, it is common to divide a territory into rectangular tiles. When all these files are read together, JMap Cloud can reconstruct a continuous map—as long as they share the same data structure (geometry, layers, and attribute types). In such cases, all files must be packaged into a single .zip archive.
Creating an SDS from Vector Files
Upload the files to JMap Cloud
Metadata analysis
Validation and configuration of SDS parameters
Once completed, the data and its configuration are stored in JMap Cloud’s databases.
Creating an SDS from Raster Files
Upload the raster file to JMap Cloud
The system analyzes and validates its characteristics
The final image is optimized for fast navigation and stored in JMap Cloud.
Go to the Data Sources tab and click Create a data source.
Select Vector/Raster data file.
Choose between:
New File: to upload a file from your device.
Existing File: to select a file already uploaded to JMap Cloud. See Uploading Files for more information.
For vector datasets, you must combine all associated files into a single .zip file before uploading.
For raster datasets, compression is not required unless you are uploading multiple files to create a mosaic—in which case they must also be combined into a .zip archive.
Configuring SDS Parameters
If uploading a new file, JMap Cloud automatically analyzes the file’s metadata (format, type, coordinate system, geographic extent, etc.) before displaying the configuration window.
If selecting an existing file, the analysis (and conversion, in the case of raster files) has already been completed, and the configuration window is shown immediately.
The configuration parameters vary depending on the data type and format. See the File Settings section for detailed information.
You can also add a description and tags to help filter and organize your data sources. To create new tags, simply enter text in the Tags field.
Finalizing the SDS
Click Create to finalize the SDS. It will appear in the data source table. Its status will show as In Preparation during processing, then Ready once the creation is complete.
Files uploaded during SDS creation are listed in the Files tab. These files are automatically deleted from JMap Cloud after 10 days.
The table shows the general settings to configure when creating a DS from vector/raster data files.
Name
Give the DS a name. There are no restrictions for the name of resources (DS, projects, map layers) in JMap Cloud.
Layer
Vector data only. This setting is specific to files that contain multiple data layers (GML, DWG, GeoJSON, etc.). Select the layer from which you are creating the SDS.
CRS
If JMap Cloud has correctly identified the CRS, this field cannot be modified. Otherwise, select the data projection system.
X
Vector data only. This setting is specific to CSV format files. Select the field (numeric values) that contains the latitude coordinates.
Y
Vector data only. This setting is specific to CSV format files. Select the field (numeric values) that contains the longitude coordinates.
Unique identifier
Optional. Vector data only. Select the field that contains the unique identifier of each map element. This identifier is necessary when you want to establish links with other data sources.
Attributes
Vector data only. File attributes are presented in a table that contains the attribute name and type as well as a box to check which attributes should be indexed.
Description
Optional. You can add a description of the data source.
Tags
Optional. You can add labels that can be used to sort or filter SDS. Tags are available for use with all resources (DS, projects, layers).
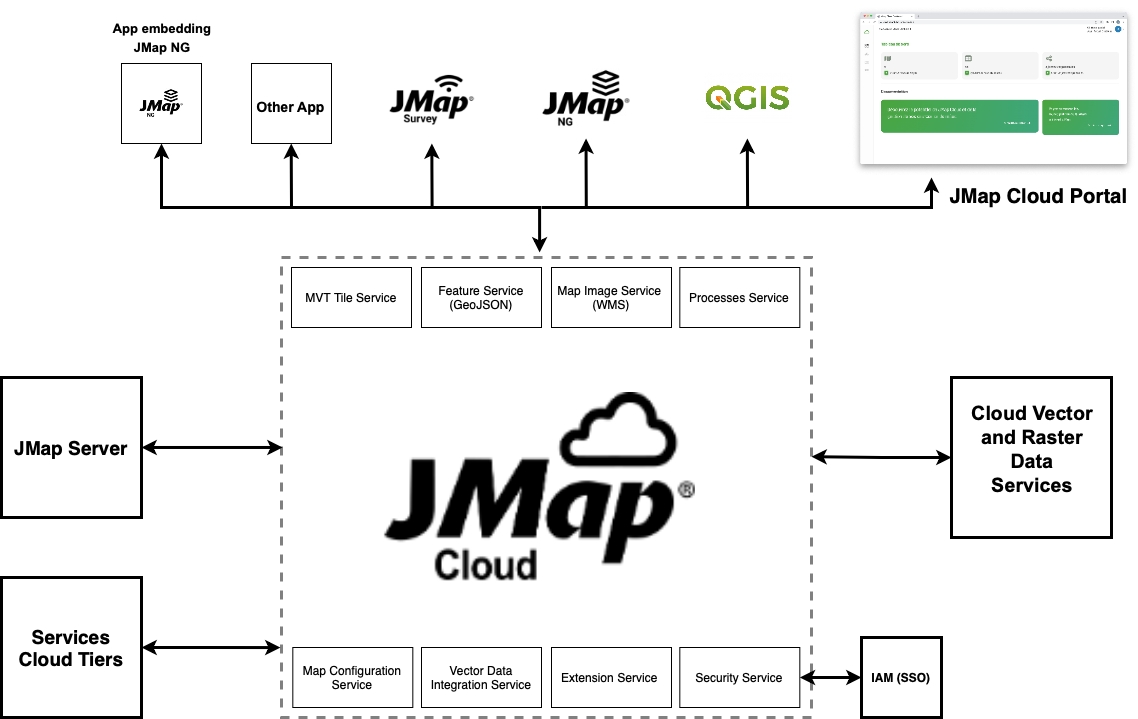

You can start JMap NG App in a div of your website, or as a full page application.
You must import App js files from our CDN links (it will automatically load the JMap Core dependency).
<script defer type="text/javascript" src="https://cdn.jsdelivr.net/npm/jmap-app-js@7_Kathmandu_HF3"></script>Make sure the version of the library matches the version of your JMap backend (JMap Cloud or JMap Server).
You have to provide required and optional parameters to the library and the app:
window.JMAP_OPTIONS = {
projectId: 1,
restBaseUrl: "https://jmapdoc.jmaponline.net/services/rest/v2.0",
anonymous: true,
map: {
zoom: 8.468052241302663,
center: {
x: -74.049048172276,
y: 45.53487085859891
}
},
hideMainLayout: true,
application: {
containerId: "my-custom-app"
}
}
}More information about startup options here
Try it out in Codepen.io
<!DOCTYPE html>
<html>
<head>
<meta http-equiv="Content-Type" content="text/html;charset=UTF-8">
<meta charset="UTF-8">
<style>
#my-custom-app {
position: relative;
overflow: hidden;
margin-left: 50px;
margin-top: 50px;
width: 850px;
height: 700px;
border: 1px solid grey;
}
</style>
<title>JMap NG</title>
</head>
<body>
<div id="my-custom-app"></div>
<script type="text/javascript">
window.JMAP_OPTIONS = {
projectId: 1,
restBaseUrl: "https://jmapdoc.jmaponline.net/services/rest/v2.0",
anonymous: true,
map: {
zoom: 8.468052241302663,
center: {
x: -74.049048172276,
y: 45.53583011032552
}
},
hideMainLayout: true,
application: {
containerId: "my-custom-app"
}
}
</script>
<script defer type="text/javascript" src="https://cdn.jsdelivr.net/npm/jmap-app-js@7_Kathmandu_HF3"></script>
</body>
</html>Try it out in Codepen.io
<!DOCTYPE html>
<html class="jmap_wrapper">
<head>
<meta http-equiv="Content-Type" content="text/html;charset=UTF-8">
<meta charset="UTF-8">
<style>
html,
body {
height: 100%;
width: 100%;
margin: 0px;
padding: 0px;
}
</style>
<title>JMap NG</title>
</head>
<body>
<script type="text/javascript">
window.JMAP_OPTIONS = {
projectId: 1,
restBaseUrl: "https://jmapdoc.jmaponline.net/services/rest/v2.0",
anonymous: true,
map: {
zoom: 8.035870457975536,
center: {
x: -74.18791345871016,
y: 45.55343159305562
}
},
hideMainLayout: true,
}
</script>
<script defer type="text/javascript" src="https://cdn.jsdelivr.net/npm/jmap-app-js@7_Kathmandu_HF3"></script>
</body>
</htmlThe card for each layer contains information such as the name of the layer, the presence of thematics, etc.
To access the available tools, pass the pointer over the card of the layer you are interested in.
The icon of the layer reproduces its style, the appearance of the objects of the layer. The icon displays a number when a thematic is configured for the layer. The section offers details on this topic.
Arbres
Layer name.
A small tooltip displays the name of the layer. If the layer has metadata (information about the data) its date of production displays in the tooltip.
Select This tool makes the elements of the layer selectable for editing, producing information reports, etc. The section provides details on this topic.
/
Display To activate or deactivate the display of the layer in the map. The section provides details on this feature.
Menu Contains other functions:
More information: the section provides details on this feature.
Zoom to layer extent: the section provides details on this feature.
The Layers panel contains the details of the project's layers and tools for different functions such as controlling the display or making the elements of a layer selectable.
Click on to open the Layers panel. The icon changes color .
Within a project, groups of layers appear in the panel in the form of cards. A group can be opened to display its subgroups and layers, or it can be closed to show only its name.
Click on the arrow in the card of a group to open it. The subgroups and layers it contains will be displayed.
Each subgroup and layer has a card that presents different functions and details of the subgroup or layer. A subgroup is displayed using the icon, and a layer is displayed using an icon representing its style.
Click on to open the subgroup card and display the layers it contains. The icon changes to , indicating that the subgroup has been deployed.
Click on to close the subgroup card.
Click on to close the group of layers card.
Pass the mouse over a layer to display the available tools. The section offers details on these tools.
Select a base map from the BASE MAP group. The name of the selected map is displayed with the name of the group.
The base map attributions display at the bottom of the map.
To speed up the identification of the layers that interest you, you can apply a filter.
Click on to open the function Layer filters.
Enter characters in the range Layer Name to filter the layers based on their name.
Click on to open the Add a filter card.
Select the attribute from the Filter by list, the operator from the Operator list, and the value by which you want to filter the layers.
Click Add. The filter is displayed in the Layer filters box. Only the layers that pass the filter are displayed in the Layers panel.
Click on to apply the filter to the map. Only the layers which pass the filter and whose display is activated are displayed in the map.
Click on to remove the layer filter. The layers appear in the Layers panel. You must turn on the display of layers to view them in the map.
<!DOCTYPE html>
<html>
<head>
<meta http-equiv="Content-Type" content="text/html;charset=UTF-8">
<meta charset="UTF-8">
<style>
#my-custom-map {
width: 600px;
height: 600px;
border: 1px solid grey;
margin-top: 1rem;
}
</style>
</head>
<body class="jmap_wrapper">
<span>Latitude: </span>
<input placeholder="Enter latitude" id="latitude" value="-73.49440489999999" />
<span>Longitude: </span>
<input placeholder="Enter longitude" id="longitude" value="45.667717299999985" />
<button id="selectFeature" onclick="alert('The map is loading, try again when the map is displayed on screen')">Select</button>
<button id="unSelectFeature" onclick="alert('The map is loading, try again when the map is displayed on screen')">
<span>Unselect</span>
</button>
<br />
<br />
<span>You can also click on the map to choose a location: </span>
<div id="my-custom-map">
</div>
<script type="text/javascript">
window.selectFeature = () => {
const latitude = Number(document.getElementById("latitude").value);
const longitude = Number(document.getElementById("longitude").value);
if (!latitude || isNaN(latitude)) {
return alert("Please enter a valid latitude");
}
if (!longitude || isNaN(latitude)) {
return alert("Please enter a valid longitude");
}
JMap.Map.Selection.selectOnAllLayersAtLocation({
x: latitude,
y: longitude
});
};
window.unSelectFeature = () => {
JMap.Map.Selection.clearSelection();
};
window.JMAP_OPTIONS = {
projectId: 1,
restBaseUrl: "https://jmapdoc.jmaponline.net/services/rest/v2.0",
anonymous: true,
map: {
containerId: "my-custom-map",
zoom: 13.797865986918877,
center: {
x: -73.49440489999999,
y: 45.667717299999985
},
},
onReady: () => {
JMap.Event.Map.on.mapLoad("my-listener", () => {
document.getElementById("selectFeature").onclick = window.selectFeature;
document.getElementById("unSelectFeature").onclick = window.unSelectFeature;
});
JMap.Event.Map.on.click("selectLocation", (res) => {
document.getElementById("latitude").value = res.location.x;
document.getElementById("longitude").value = res.location.y;
});
}
};
</script>
<script defer type="text/javascript" src="https://cdn.jsdelivr.net/npm/jmap-core-js@jmap-ng-doc"></script>
</body>
</html><!DOCTYPE html>
<html>
<head>
<meta http-equiv="Content-Type" content="text/html;charset=UTF-8">
<meta charset="UTF-8">
<style>
#my-custom-map {
width: 600px;
height: 600px;
border: 1px solid grey;
margin-top: 1rem;
}
</style>
</head>
<body class="jmap_wrapper">
<div id="my-custom-map"></div>
<script type="text/javascript">
window.JMAP_OPTIONS = {
projectId: 1,
restBaseUrl: "https://jmapdoc.jmaponline.net/services/rest/v2.0",
anonymous: true,
map: {
containerId: "my-custom-map",
zoom: 9.573700695830425,
center: {
x: -73.7219880403544,
y: 45.53690235213574
}
},
onReady: () => {
JMap.Event.Map.on.mapLoad("my-listener", params => {
const map = params.map;
map.addSource("my-custom-source", {
type: "geojson",
data: "https://data.montreal.ca/dataset/ab112a84-0661-4360-9573-652eed16beeb/resource/a90678ac-7ea7-464c-b615-e8f5cb9f527b/download/rsqa_secteurs.geojson"
});
map.addLayer({
id: "my-custom-layer",
type: "fill",
source: "my-custom-source",
paint: {
"fill-color": "#0080ff",
"fill-opacity": 0.5
}
});
});
}
};
</script>
<script defer type="text/javascript" src="https://cdn.jsdelivr.net/npm/jmap-core-js@7_Kathmandu_HF3"></script>
</body>
</html>


In this example, we will show how to add one or multiple attributions on the map in JMap NG.
Note that attributions are available in both NG Core and NG App.
In the example bellow, we add a single attribution composed of one hyperlink forwarding to k2geospatial website.
Try it out in Codepen.io
<!DOCTYPE html>
<html>
<head>
<meta http-equiv="Content-Type" content="text/html;charset=UTF-8">
<meta charset="UTF-8">
<style>
#my-custom-map {
width: 600px;
height: 600px;
border: 1px solid grey;
margin-top: 1rem;
}
</style>
</head>
<body>
<div id="my-custom-map" class="jmap_wrapper"></div>
<script type="text/javascript">
window.JMAP_OPTIONS = {
projectId: 1,
restBaseUrl: "https://jmapdoc.jmaponline.net/services/rest/v2.0",
anonymous: true,
map: {
containerId: "my-custom-map",
zoom: 13.797865986918877,
center: {
x: -75.48063889179525,
y: 45.664231577062765
},
onStartupMapReadyFn: () => {
JMap.Map.Attribution.addSingle({
id: "custom-attribution",
text: "© My custom attribution",
href: "https://k2geospatial.com/jmap-en/"
})
}
},
};
</script>
<script defer type="text/javascript" src="https://cdn.jsdelivr.net/npm/jmap-core-js@jmap-ng-doc"></script>
</body>
</html>You can add multiple attributions in one call.
In this example, we add two attributions, one composed of a hyperlink forwarding to stackoverflow website and the other composed of a random image forwading to an example domain.
Try it out in Codepen.io
<!DOCTYPE html>
<html>
<head>
<meta http-equiv="Content-Type" content="text/html;charset=UTF-8">
<meta charset="UTF-8">
</head>
<body class="jmap_wrapper">
<script type="text/javascript">
window.JMAP_OPTIONS = {
projectId: 1,
restBaseUrl: "https://jmapdoc.jmaponline.net/services/rest/v2.0",
anonymous: true,
map: {
zoom: 9.573700695830425,
center: {
x: -75.48063889179525,
y: 45.53690235213574
},
onStartupMapReadyFn: () => {
JMap.Map.Attribution.addMultiple([{
id: "custom-attribution-0",
text: "© StackOverflow",
href: "https://stackoverflow.com/"
},
{
id: "custom-attribution-1",
imageUrl: "https://picsum.photos/180/90",
href: "https://example.com/"
}
])
}
},
};
</script>
<script defer type="text/javascript" src="https://cdn.jsdelivr.net/npm/jmap-core-js@jmap-ng-doc"></script>
</body>
</html>This example shows how to toggle the visibility of a JMap layer on the map.
Try it out in Codepen.io
<html>
<head>
<meta http-equiv="Content-Type" content="text/html;charset=UTF-8">
<meta charset="UTF-8">
<style>
#toggle-button {
margin-bottom: 1rem;
}
#my-custom-map {
width: 600px;
height: 600px;
border: 1px solid grey;
}
</style>
</head>
<body class="jmap_wrapper">
<div>
<span>Toggle layer visibility: </span>
<button id="toggle-button">Wait the map is loading</button>
</div>
<div id="my-custom-map"></div>
<script type="text/javascript">
window.JMAP_OPTIONS = {
projectId: 1,
restBaseUrl: "https://jmapdoc.jmaponline.net/services/rest/v2.0",
anonymous: true,
map: {
onStartupMapReadyFn: function() {
var button = document.getElementById("toggle-button");
button.onclick = function () {
const layerId = 4
const currentLayerVisibility = JMap.Layer.isVisible(layerId);
JMap.Layer.setVisible(layerId, !currentLayerVisibility);
};
button.innerHTML = "Toggle";
},
containerId: "my-custom-map",
zoom: 8.794068040447577,
center: {
x: -73.66584749530894,
y: 45.54275797936188
},
scaleControlVisible: true,
scaleControlPosition: "top-right"
}
}
</script>
<script defer type="text/javascript" src="https://cdn.jsdelivr.net/npm/jmap-core-js@7_Kathmandu_HF3"></script>
</body>
</html>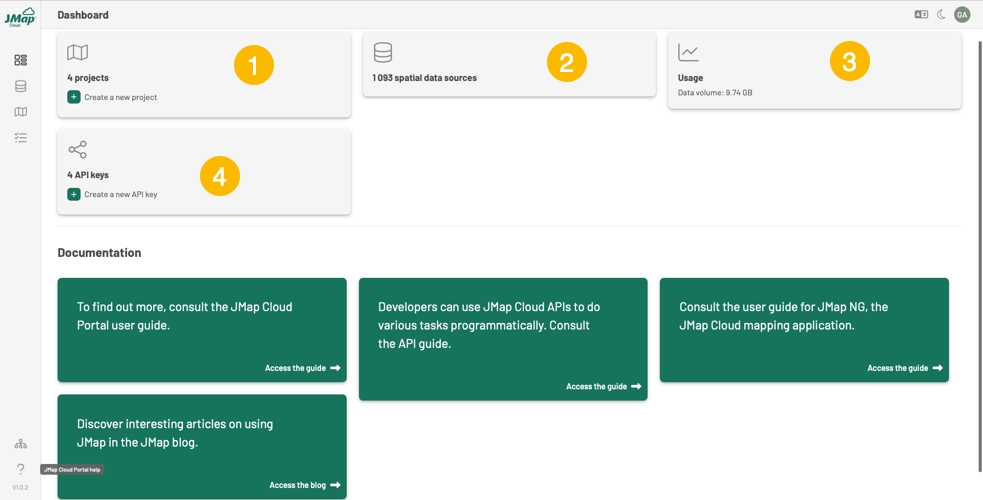
A layer's style defines the graphical representation of spatial elements on the map. This representation can be unique for all elements or can vary depending on the values of an attribute or the scale. Styles are defined by a set of rules, allowing for highly accurate and diverse representation of the layer's data.
Each layer can have different styles. For example, a layer can have one style for scales greater than 1:20,000 and another style for scales less than or equal to 1:20,000. It can also have a style that displays polygons representing city sectors, colored differently according to the crime rate in each sector.
You can enable or disable the configured styles so that they are displayed by default or not in JMap NG applications.
The Styles section, accessible by clicking on , provides tools to configure the layer's styles. The layer has a default style, of the Unique symbol type, which you can modify.
1
Click + to add a style. Three style types are available: Unique symbol, Unique values, and Classification. Details are presented in the following sections. The last style you add is displayed at the top of the section. The layer has a default style, Unique symbol, which you can modify.
2
Each style has:
A name.
A checkbox: Check the box to enable the style's display in JMap NG.
An interface containing the style's settings. The interface can be collapsed and expanded using the arrows.
3
The parameters that define the style vary depending on the type of style and the type of element to be represented (point, line, polygon, text).
This style type represents map elements with the same symbology. The symbology can vary only depending on the scale.
The style displays a default name, which you can change by clicking on .
To the left of the style name, the checkbox allows you to enable or disable the style's display on the map. When the style display is enabled, it is displayed by default in the JMap NG application map.
These two components are associated and determine the scale range within which a symbology can be applied.
Scales are expressed in zoom levels. JMap Cloud offers 24 zoom levels: level 0 corresponds to the entire planet, while level 23, which is very detailed, corresponds to a specific point on the ground (part of a building, for example). Scales displays the values 0.0 → 23.0.
Zoom levels displays a bar with two points at the extremes of the range and two boxes displaying the zoom values for those points, 0.0 and 23.0.
To set a scale threshold:
In Scales, hover over the values 0.0 → 23.0. The + icons appear over the numbers.
Click +. Scales calculates and displays the midpoint between the extremes, 0.0 → 11.5 → 23.0. Zoom levels adds a point 11.5 to the bar. You can adjust the value 11.5 by dragging the point on the bar or by typing the value in the box that displays it.
To add another interval, hover over the values in Scales and click the + icon that appears near the value where you want to create the interval. Scales displays the new midpoint. For example, if you click on + near the value 23.0, Scales calculates and displays the midpoint between 11.5 and 23.0, which is 17.3, and then displayed intervals are 0.0 → 11.5 → 17.3 → 23.0. Zoom levels displays the same intervals on the bar.
In Scales, click one of the intervals to select it. The interval becomes active on the Zoom levels bar. The boxes display its extreme values.
Drag the points to change the interval thresholds or change the values displayed in the boxes. The intervals update in Scales and Zoom levels.
To clear a threshold on Zoom levels, click . The information updates in both, Scales and Zoom levels.
This section allows you to configure the symbol that represents the elements. As shown in the previous section, you can configure different symbols for each scale range.
Details on the composition of symbols are presented in the Vector features symbology section.
This style type represents map features with symbology that varies depending on the value of an attribute.
The style displays a default name, which you can change by clicking on .
To the left of the style name, the checkbox allows you to enable or disable the style's display on the map. When the style display is enabled, it is displayed by default in the JMap NG application map.
The drop-down list allows you to select the attribute to use in the style.
The attribute can be text, date, or quantitative and must have a maximum of 500 different values. Attributes exceeding this value are not available to define this style type.
Zoom levels displays a bar with two points at the extremes of the range, along with two boxes displaying the zoom values for these points: 0.0 and 23.0.
Select the zoom level threshold within which the style will be displayed in applications such as JMap NG.
You can drag the points on the bar or enter the values in the boxes.
Click the arrow to expand the Conditions section and display each of the attribute's conditions or unique values.
Click to display the available automatic color palettes. There are several palettes: miscellaneous, single hue, multi hues, divergent, and qualitative. Each palette maximizes the differences between the unique values. Click on the palette of your choice to apply it to the entire set of conditions.
Click the arrow for each condition to open its configuration interface. This varies depending on the geometry of the layer's elements. Details are presented in the Vector features symbology section. The symbology for each condition can be configured independently of the other conditions.
Click to edit the condition name and make the legend more understandable.
Click to clear the condition. The other conditions are not changed. The style does not display the cleared condition.
The components of the Symbol section vary depending on the layer's features.
You can compose the symbol for point features by layering several different icons. Press + to add an icon to the symbol and to remove an icon from the symbol. Each icon adds a tab containing its parameters.
Icon
The drop-down menu allows you to select the vector icon.
Color
Select the icon color. You have several methods: color field, color bar, RGB and HEX codes.
Opacity
Specify the degree of opacity of the icon color.
Size
Specify the icon size. A value of 1 corresponds to the original icon size.
Rotation (º)
Specify the rotation (in degrees) to apply to the icon.
Offset X and Y
Adjust the symbol's origin point by offsetting the symbol in X and Y directions by the specified values. The origin point corresponds to the precise coordinate of the point element.
You can compose the symbol for linear features by layering several different line styles. Press + to add a line style to the symbol and to remove a line style from the symbol. Each line style adds a tab containing its settings.
Color
Select the line color. You have several methods: color field, color bar, RGB and HEX codes.
Opacity
Specify the degree of opacity of the line.
Line style
Click the icon to specify the line style, which consists of:
Line end
Line junction
Dash pattern. Press + to specify whether the line is dashed and to determine the size of the dash and the space between dashes. You can add multiple dash sizes and spacings, which will be drawn one after the other.
Thickness
Specify the thickness of the line.
These are the parameters that define the symbology of polygonal elements:
Fill color
Select the polygon's fill color. You have several methods: color field, color bar, RGB and HEX codes.
Opacity
Specify the degree of opacity of the polygon's fill color.
Border color
Select the polygon's border color. You have several methods: color field, color bar, RGB and HEX codes.
Opacity
Specify the degree of opacity of the polygon's border.
Thickness
Specify the thickness of the border.
Dash pattern
Press + to specify whether the polygon's border is dashed and to determine the size of the dash and the space between dashes.
The font is not editable. You can specify these parameters:
Bold
Select this option to use the bold font.
Italic
Select this option to use the italic font.
Color
Select the text color. You have several methods: color field, color bar, RGB and HEX codes.
Contour
Click on the icon to activate contour drawing and select its color. You have several methods: color field, color bar, RGB and HEX codes.
Opacity
Specify the degree of opacity of the text.
The tools found in the Measurements panel allow you to measure distances and surfaces (area and perimeter) on the map.
The Measurements panel contains the application's measurement tools.
Click on to open the Measurements panel. The icon changes color .
1
Tools to measure distances.
2
Tools to measure surfaces.
3
Tools to measure circular surfaces.
4
Tools to: - Indicate the number of measurements performed, - select measurements to edit or delete them, or - delete all measurements.
5
Instructions on how to make measurements.
Select the measurement tool you wish to use by clicking on its icon. The icon changes color. The Measurement tools section explains the features of these tools and how to use them.
Make your measurements. You can use the different tools; the measurements will all be added to the map, and the distances and/or areas measured will be displayed in the card of the corresponding tool. The total number of measurements made is displayed in the panel.
Several tools allow you to take measurements. They are described below.
This tool allows you to measure distances. The measurement unit in which the distances are expressed is selected in the user settings.
Click on the icon to enable the tool. The icon changes color. Instructions appear at the bottom of the map to help you make your measurements.
Click on the map once to begin your measurement.
Click on the map to define the vertices of the line.
Double-click or click on the space bar to complete your measurement. The length of each segment and the total length of the line will be displayed in the map. The total distance is also displayed in the Distance card.
Repeat the measurements, as needed. The lines are displayed in the map, and the total distance of all the lines is displayed in the Distance card.
Click on in the Distance card to delete the lines.
This tool allows you to measure surfaces by drawing polygons. The measurement unit in which the surfaces of polygons are expressed is selected in the user settings.
Click on to enable the tool. The icon changes color. Instructions appear at the bottom of the map to help you make your measurements.
Click on the map once to begin your measurement.
Click on the map to define the vertices of the polygon.
Double-click or click on the space bar to complete your measurement. The length of each segment, perimeter, and surface of the polygon will be displayed in the map. The surface of the polygon is also displayed in the Surface card.
Repeat the measurements as needed. Polygons are displayed in the map, and the total surface of all polygons measured is displayed in the Surface card.
Click on in the Surface card to delete the measurements.
This tool allows you to measure surfaces by drawing circles in the map. The unit of measurement in which the surfaces of circles are expressed is selected in the user settings.
Click on the icon to enable the tool. The icon changes color. Instructions appear at the bottom of the map to help you make your measurements.
Click once on the map to define the center of the circular surface you intend to measure.
Slide the mouse pointer on the map to define the circle's radius.
Click on the map or press the space bar to complete the measurement. The radius, circumference, and area (or surface) of the circle are shown in the map. The surface is also displayed in the Circular surface card.
Repeat the measurements, as needed. The circles are displayed in the map, and the total surface of all measurements (circles) is displayed in the Circular surface card.
Click on in the Circular surface card to delete the circles.
You can change the shape and location of measurements or delete them. You can only modify the shape of one measurement at a time. You can modify the location of or delete several measurements at once.
Click on Select to select the measurement you wish to modify. The button changes color.
Select the measurement you wish to modify by clicking on it. The vertices of the line, polygon or circle are displayed.
Select a vertex by clicking on it to move it. The vertex turns black.
Drag and drop the vertex to the desired position to change the shape of the measurement.
Click on the map to finish modifying the shape of the line, polygon or circle.
Click on Select in order to select the measurements you wish to move. The button changes color.
Select a measurement by clicking on it. The vertices of the measurement are displayed.
Press and hold the SHIFT key, then click on the other measurements to add them to your selection.
Drag the mouse pointer to move the measurements, and drop them at the desired location on the map.
Click on the map to unselect the measurements.
Click on Select to select the measurements you wish to delete. The button changes color.
Select a measurement by clicking on it. The vertices of the measurement are displayed.
Press and hold the SHIFT key, then click on the other measurements to add them to your selection.
Click on the Delete button, which displays the number of selected measurements in parentheses. The selected measurements are deleted.
You can upload files to JMap Cloud to use them later when creating data sources. The Files tab, located in the Data Sources section, provides tools to upload and manage your files.
The content of uploaded files is stored in JMap Cloud’s databases. However, files listed in the Files table are automatically deleted after 10 days.
This tab displays a table of all the files you’ve uploaded. A button is available to let you upload new files.
The table includes the following information for each file:
File name
Data type (vector, raster, or tabular)
Format
Size
Status
Upload date
Supported file formats:
Vector data (compressed .zip file): GeoJSON, SHP, File GeoDatabase, GML, TAB, CSV, DWG, GeoPackage
Raster data (uncompressed file): GeoTIFF
Tabular data (compressed .zip file): CSV
You can select one or more files in the table using the checkboxes. When selected, the Delete option becomes available, allowing you to delete multiple files at once.
Since spatial vector datasets typically consist of multiple files, you must compress them into a single .zip archive before uploading. Non-spatial tabular data files must also be uploaded as compressed .zip archives.
Compression is not required for raster files, unless you are uploading multiple files to be used as a mosaic—then, they must be grouped into a single .zip archive.
Upload Methods:
Drag and drop one or more files directly into the table. The upload will start automatically.
Or click Upload a file to open the file browser and select your files. Uploading will start automatically.
The status of each file indicates which step of the process was completed by JMap Cloud.
Waiting
The file is waiting to be uploaded.
Processing
The file is being analyzed.
Analyzed
The file has been analyzed by JMap Cloud which identifies properties such as file type, CRS, attributes, etc. It is available to create a spatial data source.
Uploading
The file is being uploaded. A line in the Status column indicates the progress of the upload. A circle in the header bar indicates the progress of the upload as well as the number of files being uploaded. A message indicates whether the upload was successful or failed.
Uploaded
The file has been uploaded. It needs to be analyzed to be available for creating a spatial data source.
Error
There is an error in the file loading process.
As with other JMap Cloud resources, you can manage a file by clicking the icon that appears when hovering over the row. Available actions depend on the file’s status:
Create Data Source
Delete
Cancel Upload
View Info
If the file’s status is Analyzed, the Create source option becomes available. Click it to open the data source creation interface.
Enter the necessary details based on the file type. For more information, refer to the sections:
Click Create to generate the data source. It will then appear in the Data Sources tab.
This option is available when the file is still uploading or being analyzed. It lets you stop the process.
Click Display informations to see the following details:
File name, size, format, and status
The ID of the user who uploaded it
Upload date and time
Metadata, which includes:
Unique file, organization, and task identifiers
Data layer names
Attribute names and types
Number of features or records
Click Delete. A confirmation prompt will appear.
Deleting the file does not remove any data source that may have been created from it. Only the file itself is deleted from the table.
JMap Cloud NG is a fork of the first generation of JMap NG that was the official JMap Server/JMap Cloud web client up until JMap Server Kathmandu.
JMap Cloud NG is the official NG Client for JMap Cloud. JMap Cloud NG is only compatible with JMap Cloud. All JMap Server specific capabilities of JMap Cloud NG have been removed after the fork from JMap NG (first generation).
Allow creating Thematics on-the-fly. It is now possible to add a custom Style Rule (Thematic) to an existing layer in NG for JMap Cloud. A detailed example is available . This thematic is only available during the current session, it is not persisted.
Mew API methods:
JMap.Layer.Thematic.addThematic(params)
JMap.Layer.Thematic.deleteThematic(layerId, thematicId) (delete any thematic, client-side, for the current session only)
JMap.Map.resetSelectionStyle() , a new API method to reset the selection style of a layer that was previously modified with JMap.Map.setSelectionStyle()
New options for API method JMap.Application.Print.takeCapture :
(... ,customRatioWidth, customRatioHeight) lets specify a custom aspect ratio for the generated image
Measurements panel; error when selecting Nautical Miles as the unit for an area measure
Fix several problems with dynamic filters when working with Date or DateTime attributes
Support snapping on layer elements in all draw environments (feature creation, measures, annotations)
New API methods:
JMap.Feature.getByLayerId(layerId, bbox) (retrieves features from a layer)
JMap.Application.Annotation.setSnapEnabled(enabled)
JMap.Application.Annotation.setSnapLayerId(layerId)
JMap.Application.Geometry.setSnapEnabled(enabled)
JMap.Application.Geometry.setSnapLayerId(layerId)
JMap.Application.Measure.setSnapEnabled(enabled)
JMap.Application.Measure.setSnapLayerId(layerId)
make JMap.Application.Print.takeCapture return a data URL instead of triggering a browser download
modified API method: JMap.Application.Print.takeCapture(returnAsDataUrl)
Added the JMap.Map.setSelectionStyle() method to set the selection style of a layer. Allows developer to change the selection style of a layer see for details
fix problem when calling JMap.Feature.getByIds with too many IDs
fix problem when calling JMap.Layer.Search.byAttribute with too many attribute values
Unable to use ''Ctrl+V'' with a numeric value in a dynamic filter on a layer
ngExtent url startup param is not working anymore
Measure panel doesn't scroll
fix marker registration when creating a new point feature in geometry creation panel
JMap.Layer.attributeExists() does not work
Export selection as Excel file is broken
Layer names in selection panel are visible when they overflow the panel's width
"Recenter the Map" widget does not work properly
The last character of the result of the substring function is missing in the mouseover.
New CRS support refactoring:
Modified API methods:
JMap.Projection.reprojectLocation() is now asynchronous
JMap.Projection.reprojectBoundaryBox() is now asynchronous
Removed API methods:
JMap.Map.isLayerRendered() has been removed
JMap.Map.getLayersVisibilityStatus() has been removed
JMap.Map.getLayersVisibilityStatusAsArray() has been removed
JMap.Map.getRenderedJMapLayerIds() has been removed
Improve mouseover display
Add support for JMap Cloud Simple Search feature
JMap Cloud now supports a global search mechanism for finding information in any indexed patial data sources or in a whole project through all its indexed spatial data sources (/rest/v1/organizations/{organization}/spatialdatasources/{spatialdatasource}/search and /rest/v1/organizations/{organization}/projects/{project}/search)
Added API methods:
JMap.SimpleSearch.setQueryString(queryString: string)
JMap.SimpleSearch.getMinimumQueryStringLength()
JMap.SimpleSearch.getInvalidQueryStringCharacters()
New API events:
JMap.Event.SimpleSearch.on.success
JMap.Event.SimpleSearch.on.error
Add support for 3D DEM
When opening a project that has an associated DEM file, the DEM is displayed on the map
New API methods:
JMap.Map.isTerrainAvailable()
JMap.Map.isTerrainActive()
JMap.Map.setTerrainActive(active:boolean)
let the user choose between EPSG:4326 (Lat-Lon) and the project’s CRS for the mapInfo widget coordinates
Error calculating extent for a WMTS service
Mouseover horizontal scrollbar appears for nothing
Modify UI to ask for current password when changing password
Login page, problem entering Username and Password fields
Problem downloading map captures from the Exportation / Print Tool section (with MapLibre)
An hyperlink in an attribute doesn’t work in the mouseover
JMap.Feature.getByIds() method doesn’t display retrieved features on the map
Unable to sort columns in attribute table for selected features
Problems interpreting dates in string (ISO)
Removed Thematic Legend Title and Legend Subtitle from UI
Open JMap Cloud NG with an URL using ngSearch query param does not work
Removed conditional logic in JMap Cloud NG for switching between JMap Cloud and JMap Server
Removed API methods:
JMap.Server.getType()
JMap.Server.isSaas()
JMap.Server.isLegacy()
JMap.Server.getMinimumVersion()
Modified API methods:
JMap.Feature.deleteByIds() now returns a Promise<JId> instead of a Promise<GeoJSON.Feature>
removed/renamed/modified types/enums/interfaces:
removed JSERVER_TYPES
renamed JSERVER_SAAS_STATUS to JSERVER_STATUS
renamed JServerSaasService to JServerService
renamed JServerSaasServiceById to JServerServiceById
JJMapCloudPasswordPolicyCompliance
removed JMinimumServerVersion
removed title and subTitle from JLayerThematic
JJMapCloudPasswordPolicyCompliance renamed to JJMapPasswordPolicyCompliance
removed refreshToken from JTokenInfo
The mouseover is a popup window that is displayed after clicking on features on the map.
If no mouseover content is set in the layer configuration, no popup is displayed when clicking on a feature of that layer.
You can set your own mouseover content programatically in Javascript. For instance, you can add a mouseover on a layer that has no mousoever content in its configuration.
In the following example, the layer "Hydrography", id=3, has no mouseover defined.
We will set a custom mouseover content that:
Always displays a custom header
Displays the mouseover content for a clicked hydrography feature
Avoids displaying a mouseover for the "Event" layer (blue dots on the map)
Always displays a custom footer
Try it out in
<!DOCTYPE html>
<html>
<head>
<meta http-equiv="Content-Type" content="text/html;charset=UTF-8">
<meta charset="UTF-8">
<style>
#my-custom-app {
position: relative;
overflow: hidden;
width: 850px;
height: 700px;
border: 1px solid grey;
}
</style>
</head>
<body>
<div id="my-custom-app" class="jmap_wrapper"></div>
<script type="text/javascript">
window.JMAP_OPTIONS = {
projectId: 1,
restBaseUrl: "https://jmapdoc.jmaponline.net/services/rest/v2.0",
anonymous: true,
map: {
zoom: 9.573700695830425,
center: {
x: -73.7219880403544,
y: 45.53690235213574
}
},
application: {
containerId: "my-custom-app",
panel: "test-form-panel",
extensions: [{
id: "test-form",
panelTitle: "Test of form component API",
initFn: () => {/* nothing to do */},
onPanelCreation: panelContainerId => {
document.getElementById(panelContainerId).style.padding = "1rem"
JMap.Application.Form.render(panelContainerId, {
id: "search-form",
schema: {
properties: {
name: {
title: "Office Name",
type: "string",
isRequired: true,
maxLength: 255
},
type: {
title: "Office type",
type: "number",
// default: 2,
enum: [1, 2, 3],
enumNames: ["Local", "External", "Mixte"]
}
}
},
uiSchema: [
{
type: "Tab",
controls: [
{
id: "name",
label: "Office name",
widget: "input",
scope: "#/properties/name"
},
{
id: "type",
label: "Office type",
widget: "select",
scope: "#/properties/type"
}
]
}
],
defaultValueById: { // defaultValueById is optional
name: "default value",
type: 2
},
validate: (values, formMetaData) => JMap.Form.validateData(formMetaData, JMap.Form.getPreparedData(formMetaData, values)),
onSubmit: values => {
// Here you process/persist the data. This function can:
// - returns nothing: means onSubmit success
// - returns a string: the string is an error that will be displayed
// - returns a promise: the form will display a loading button until the promise resolved
JMap.Application.Message.info(`Submitted values: ${JSON.stringify(values)}`)
}
})
},
onPanelDestroy: panelContainerId => {
JMap.Application.Form.destroyByContainerId(panelContainerId)
}
}]
}
};
</script>
<script defer type="text/javascript" src="https://cdn.jsdelivr.net/npm/jmap-app-js@7_Kathmandu_HF3"></script>
</body>
</html><!DOCTYPE html>
<html>
<head>
<meta http-equiv="Content-Type" content="text/html;charset=UTF-8">
<meta charset="UTF-8">
<style>
#my-custom-map {
width: 600px;
height: 600px;
border: 1px solid grey;
}
</style>
</head>
<body class="jmap_wrapper">
<div id="my-custom-map"></div>
<script type="text/javascript">
const HYDRO_LAYER_ID = 3;
const PLACE_LAYER_ID = 6;
window.JMAP_OPTIONS = {
projectId: 1,
restBaseUrl: "https://jmapdoc.jmaponline.net/services/rest/v2.0",
anonymous: true,
map: {
containerId: "my-custom-map",
zoom: 13.797865986918877,
center: {
x: -73.48063889179525,
y: 45.664231577062765
}
},
extensions: [{
id: "custom-mouseover-extension",
initFn: () => {
JMap.Event.MouseOver.on.beforeContentProcessed("My-custom-mouse-over", params => {
const {
selection,
getFeaturesByLayerId,
addHtmlContentAtTheBeginning,
addHtmlContentAtTheEnd,
removeFeaturesFromLayerSelection
} = params;
/* this method is processed each time we click on features on the map, even if no mouse-over is defined for a layer */
/* add a message in the top of the mouseover popup */
addHtmlContentAtTheBeginning(`<span style="font-size: 1rem">Custom popup header visible for all layers</span>`);
/* add a message in the bottom of the mouseover popup */
addHtmlContentAtTheEnd(`<span style="font-size: 1rem">Custom popup footer visible for all layers</span>`);
console.info("All selected features", { ...selection });
/* if some place feature has been selected, remove it from the mouseover */
removeFeaturesFromLayerSelection(PLACE_LAYER_ID, getFeaturesByLayerId(PLACE_LAYER_ID).map(f => f.id));
console.info("Selected hydrography features", getFeaturesByLayerId(HYDRO_LAYER_ID));
})
},
renderMouseOver: (layer, feature) => {
/* this method is processed for each feature that has been clicked */
if (layer.id !== HYDRO_LAYER_ID) {
return;
}
return {
html: `
<div style="display: flex; flex-direction: column; align-items: center;">
<span>
Hydro feature id="${feature.id}" clicked !
</span>
<button
onclick="alert('Feature id=${feature.id} clicked !')"
style="cursor: pointer; border: 1px solid grey; margin: .5rem;">
Click me !
</button>
</div>`
};
}
}]
}
</script>
<script defer type="text/javascript" src="https://cdn.jsdelivr.net/npm/jmap-core-js@7_Kathmandu_HF3"></script>
</body>
</html>


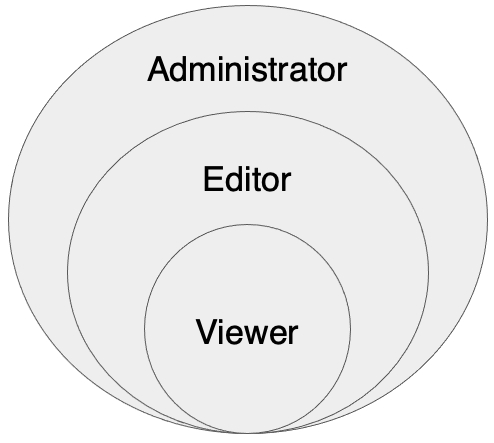
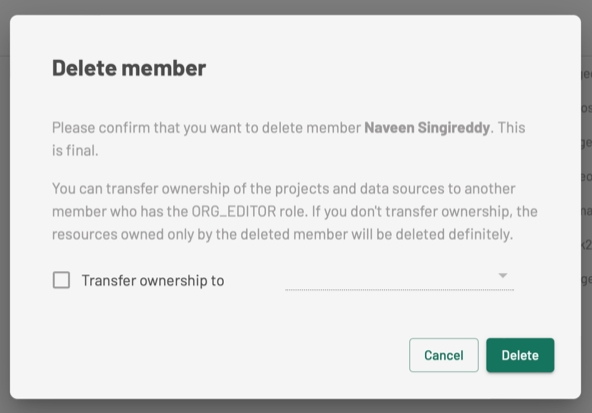
The user interface is comprised of the following:
A lateral bar with icons allowing you to access menus with the application features, which are organized into panels.
Geographic positioning and map scale tools.
The map itself, which displays the application data.
Arrow to open a panel. Each panel displays the name of the project that is open in the application.
To switch projects, click on Projects. The projects interface appears. You can select a new project by clicking on it.
This arrow closes the panel.
Search for a place. For details on this feature, refer to . This feature is only available when a Mapbox API key is configured. Contact your JMap administrator for more details.
Search on the project. For details on this feature, refer to .
Click on this icon to display the Layers panel. For details on the features of this panel, refer to .
Click on this icon to display the Search on map panel. This function is not yet available.
Click on this icon to display the Selection panel. For details on the features of this panel, refer to .
Click on this icon to display the Measures panel. For details on the features of this panel, refer to .
Click on this icon to display the Annotations panel. For details on the features of this panel, refer to .
Click on this icon to display the Exportation / Print panel. For details on the features of this panel, refer to .
Click on this icon to access JMap NG's user and developer documentation.
Click on this icon to display the Profile and user settings panel. For details on the features of this panel, refer to .
Click on this icon to show the geographic information of the map: the scale and the coordinates of the cursor in Latitude and Longitude. You can change the scale of the map or center it in a specific coordinate. For details on these features, refer to .
When clicking on this icon, the map display will return to the last position viewed.
When clicking on this icon, the map will return to the default rotation. For details on this feature, refer to .
Bar scale. The scale indicates the actual size of the line in the map. As you navigate and zoom in and out on the map, the distance displayed in this line will vary. The distance is displayed in the unit selected in the Profile and user settings panel.
Each panel contains features and information. Each panel contains a breadcrumb that allows you to switch projects.
You can start JMap NG Core in a div of your website, or as a full page application.
To use the JMap NG Core library, simply import the JMap NG Core Javascript library from our CDN link.
Make sure the version of the library matches the version of your JMap Server instance.
You have to specify options to the library:
More information about startup options
Try it out in
Instead of running JMap NG Core inside a DIV, you can start it directly in the body of the web page for a full page experience.
Try it out in
<!DOCTYPE html>
<html>
<head>
<meta http-equiv="Content-Type" content="text/html;charset=UTF-8">
<meta charset="UTF-8">
<style>
#my-custom-map {
width: 600px;
height: 600px;
border: 1px solid grey;
margin-top: 1rem;
}
</style>
</head>
<body class="jmap_wrapper">
<button
id="selectFeature"
onclick="alert('The map is loading, try again when the map is displayed on screen')">
Find, select, and display feature
</button>
<button
id="unSelectFeature"
onclick="alert('The map is loading, try again when the map is displayed on screen')">
Unselect feature
</button>
<div id="my-custom-map"></div>
<script type="text/javascript">
const PLACE_LAYER_ID = 6;
const FEATURE_ID = 33;
let isLoading = false;
window.selectFeature = () => {
if (isLoading) {
return alert("Locating the feature, please wait");
}
isLoading = true;
if (!JMap.Layer.isSelectableById(PLACE_LAYER_ID)) {
JMap.Layer.setSelectabilityById(PLACE_LAYER_ID, true);
}
JMap.Feature
.getById(PLACE_LAYER_ID, FEATURE_ID)
.then(feature => {
isLoading = false;
JMap.Map.Selection.setLayerSelection(PLACE_LAYER_ID, feature);
JMap.Map.fitFeatures([feature]);
})
.catch(error => {
isLoading = false;
console.error("An error occured", error);
alert("Cannot get the feature !");
});
};
window.unSelectFeature = () => {
JMap.Map.Selection.clearLayersSelection([PLACE_LAYER_ID]);
};
window.JMAP_OPTIONS = {
projectId: 1,
restBaseUrl: "https://jmapdoc.jmaponline.net/services/rest/v2.0",
anonymous: true,
map: {
containerId: "my-custom-map",
zoom: 13.797865986918877,
center: {
x: -73.48063889179525,
y: 45.664231577062765
}
},
onReady: () => {
JMap.Event.Map.on.mapLoad("my-listener", () => {
document.getElementById("selectFeature").onclick = window.selectFeature;
document.getElementById("unSelectFeature").onclick = window.unSelectFeature;
});
}
};
</script>
<script defer type="text/javascript" src="https://cdn.jsdelivr.net/npm/jmap-core-js@7_Kathmandu_HF3"></script>
</body>
</html><script defer type="text/javascript" src="https://cdn.jsdelivr.net/npm/jmap-core-js@7_Kathmandu_HF3"></script>window.JMAP_OPTIONS = {
projectId: 1,
restBaseUrl: "https://jmapdoc.jmaponline.net/services/rest/v2.0",
anonymous: true,
map: {
containerId: "my-custom-map",
zoom: 9.757829447748511,
center: {
x: -73.60243569463414,
y: 45.504533166207324
},
scaleControlVisible: true,
scaleControlPosition: "top-right"
}
}<!DOCTYPE html>
<html>
<head>
<meta http-equiv="Content-Type" content="text/html;charset=UTF-8">
<meta charset="UTF-8">
<style>
#my-custom-map {
margin-left: 50px;
margin-top: 50px;
width: 400px;
height: 400px;
border: 1px solid grey;
}
</style>
<title>JMap Core</title>
</head>
<body class="jmap_wrapper">
<div id="my-custom-map"></div>
<script type="text/javascript">
window.JMAP_OPTIONS = {
projectId: 1,
restBaseUrl: "https://jmapdoc.jmaponline.net/services/rest/v2.0",
anonymous: true,
map: {
containerId: "my-custom-map",
zoom: 8.702330187924481,
center: {
x: -73.71123535973672,
y: 45.565083749787306
},
scaleControlVisible: true,
scaleControlPosition: "top-right"
}
}
</script>
<script defer type="text/javascript" src="https://cdn.jsdelivr.net/npm/jmap-core-js@7_Kathmandu_HF3"></script>
</body>
</html><!DOCTYPE html>
<html>
<head>
<meta http-equiv="Content-Type" content="text/html;charset=UTF-8">
<meta charset="UTF-8">
<title>JMap Core</title>
</head>
<body>
<script type="text/javascript">
window.JMAP_OPTIONS = {
projectId: 1,
restBaseUrl: "https://jmapdoc.jmaponline.net/services/rest/v2.0",
anonymous: true,
map: {
zoom: 9.01995956737214,
center: {
x: -73.69369778619411,
y: 45.50946387970188
}
}
}
</script>
<script defer type="text/javascript" src="https://cdn.jsdelivr.net/npm/jmap-core-js@7_Kathmandu_HF3"></script>
</body>
</html>


This section displays a table listing all API keys associated with your organization.
For each key, the table shows the following information:
Title
Unique identifier (ID)
Name of the user who created it
Creation date
Expiration date
A context menu in each column header allows you to sort, filter, hide, or show specific attributes as needed.
To add a new API key:
Click Create new API key.
Enter a name, select an expiration date, and choose a role from the dropdown menu (only Editor and Viewer roles can be assigned to API keys). Fields marked with an asterisk (*) are required.
Click Create.
A message will inform you that the key is private and must be kept secret and secure. Once the window is closed, the key cannot be viewed again. Be sure to copy it immediately using the icon if you need it for future use.
Click OK to confirm. The key will now appear in the table.
To manage an existing API key hover over the row of the key to reveal the menu, then click it to access the following options:
View information
Delete
The information view displays:
The title
The creator’s name
The assigned role
The email address
The expiration date
You can copy the email address to the clipboard using the icon.
You may delete unused API keys, but be aware of the consequences: a key may own resources such as data sources, projects, layers, and tables.
Before deletion, you should transfer ownership of these resources to another organization member. Otherwise, they will be permanently deleted along with the key.
Deletion steps:
Click the menu next to the key, then select Delete.
A confirmation message will appear. Confirm your intention to proceed.
If the key owns resources, a list of members with the Editor role will be displayed. Select one to transfer resource ownership.
If the key does not own any resources, you’ll be asked to confirm the final deletion.
The selected member becomes the new owner of the transferred resources. The key’s access permissions (ACL entries) are removed.
Any resources exclusively owned by the deleted key will also be permanently deleted. Deleting an API key is irreversible—it is permanently removed from JMap Cloud.
<!DOCTYPE html>
<html>
<head>
<meta http-equiv="Content-Type" content="text/html;charset=UTF-8">
<meta charset="UTF-8">
<style>
#my-custom-map {
width: 600px;
height: 600px;
border: 1px solid grey;
margin-top: 1rem;
}
</style>
</head>
<body class="jmap_wrapper">
<span>Postal code: </span>
<input placeholder="Enter postal code" id="postalCode" value="H1A 1T9"/>
<button
id="searchButton"
onclick="alert('The map is loading, try again when the map is displayed on screen')">
Search features
</button>
<div id="my-custom-map"></div>
<script type="text/javascript">
const PLACE_LAYER_ID = 6;
let isSearching = false;
window.search = () => {
if (isSearching) {
return alert("Search in progress, please wait");
}
const postalCode = document.getElementById("postalCode").value;
if (!postalCode) {
return alert("Please enter a postal code");
}
isSearching = true;
if (!JMap.Layer.isSelectableById(PLACE_LAYER_ID)) {
JMap.Layer.setSelectabilityById(PLACE_LAYER_ID, true);
}
JMap.Layer.Search
.byAttribute({
layerId: PLACE_LAYER_ID,
attributeName: "CODE_POSTA",
attributeValue: postalCode
})
.then(features => {
console.log("Features", features);
isSearching = false;
if (features.length === 0) {
JMap.Map.Selection.clearLayersSelection([PLACE_LAYER_ID]);
return alert("No feature found !");
}
JMap.Map.Selection.setLayerSelection(PLACE_LAYER_ID, features);
JMap.Map.fitFeatures(features);
})
.catch(error => {
isSearching = false;
console.error("An error occured", error);
alert("An error occured");
});
};
window.JMAP_OPTIONS = {
projectId: 1,
restBaseUrl: "https://jmapdoc.jmaponline.net/services/rest/v2.0",
anonymous: true,
map: {
containerId: "my-custom-map",
zoom: 13.797865986918877,
center: {
x: -73.48063889179525,
y: 45.664231577062765
}
},
onReady: () => {
JMap.Event.Map.on.mapLoad("my-listener", () => {
document.getElementById("searchButton").onclick = window.search;
});
}
};
</script>
<script defer type="text/javascript" src="https://cdn.jsdelivr.net/npm/jmap-core-js@7_Kathmandu_HF3"></script>
</body>
</html>You can interactively select map elements that belong to one or more layers using the selection tools. After doing this, you can view the attributes of the selected elements and export the data in various formats.
The selection tools are found in the Selection panel.
To select elements in layers, you must first make these selectable. For detailed steps on how to do this, refer to Making layer elements selectable.
The Selection panel contains the selection tools that are available in the application.
Click on to open the Selection panel. The icon changes color .
1
Selection tools.
2
The legend indicates the number of layers with elements that are selectable.
3
Directions to help you make an interactive selection.
4
The map displays the layers whose elements are selectable.
Select the tool of your choice by clicking on it. The tool's icon changes color. The Interactive selection tools section explains the features of these tools and how to use them.
Select elements in the map. You can select elements from all selectable layers at once.
To add elements to your selection, using the same tool or a different one, press and hold the ⌘ key on a Mac or the Ctrl key on a PC. The instructions at the bottom of the screen indicate how to add or remove elements in your selection.
The Selection results section provides details on how to use the application's tools to work with the selected elements.
Several tools are available to select elements:
Point selection Allows you to select one element at a time by clicking on each one. 1. Click on an element to select it. 2. To add another element to your selection, press and hold the ⌘ key on a Mac or the Ctrl key on a PC. 3. When holding down the ⌘ or Ctrl key, you can click on a new element to add it to the selection, or click on one of the selected elements to remove it from the selection. As you select elements, their information is displayed in the Selection panel.
Line selection Allows you to select one or many elements by drawing a line. All elements that are on the line's path will be selected. Note: this option does not work with layers of points. 1. Click on the map once to indicate where the line starts. 2. Slide the mouse pointer to draw the line. 3. Double-click or press the space bar to complete the line. If you draw another line, the elements selected with the first line will be unselected. The data of the selected elements is displayed in the Selection panel.
Circular selection Allows you to select one or more elements by drawing a circle. All elements that are entirely or partially included in the circle are selected. 1. Click once on the map to define the center of the circle. 2. Slide the mouse pointer to define the radius of the circle. 3. Click again or press the space bar to complete the circle. If you draw another circle, the elements selected with the first circle will be unselected. The data of the selected elements is displayed in the Selection panel.
Rectangular selection Allows you to select one or more elements by drawing a rectangle. All elements that are entirely or partially included in the rectangle are selected. 1. Click once to define one of the vertices of the rectangle. 2. Slide the mouse pointer to define the rectangle. 3. Click again to define the opposite vertex of the rectangle. If you draw a new rectangle, the elements selected with the first rectangle will be unselected. The data of the selected elements is displayed in the Selection panel.
Polygonal selection Allows you to select one or more elements by drawing a polygon. All elements that are entirely or partially included in the polygon are selected. 1. Click to define the first vertex of the polygon. 2. Click to define the following points that form the polygon. 3. Double-click or press the space bar to complete the polygon. If you draw a new polygon, the elements selected with the first polygon will be unselected. The data of the selected elements is displayed in the Selection panel.
The results are displayed in the Selection panel and in the map.
The selected elements will remain selected until they are unselected or until their layer is no longer selectable.
1
The selected map objects or elements are indicated in yellow on the map. If you click on an element with the point selection tool enabled, the element remains selected and the other elements are unselected.
2
Selection tools.
3
This legend indicates the number of selected elements and the number of layers to which they belong.
4
Layer Select the layer for which you want to display the cards of selected elements, view the data table, export the data to an Excel file or unselect elements. These operations will only apply to the layer you choose. The name of each layer is accompanied by the number of selected elements.
5
Several tools allow you to work with the elements selected from the layer you indicated in the Layer field: 1. Click on to modify the selected elements. This function is not yet available. 2. Click on to place all of the layer's selected elements in the center of the map. If the scale changes, it is possible that the layer will no longer be visible. 3. Click on to open a table displaying the attribute data of the selected elements. The icon will darken. The section presents the details of this table. 4. Click on to close the data table. 5. Click on to download an Excel file containing the attributes of all selected elements. 6. Click on to unselect the layer elements. The elements selected from other layers will remain selected.
6
For each selected element, a card displays the attribute values: 1. You can browse through the list of cards. There is one card for each selected element. 2. Click on an element's card to place that element in the center of the map. Click on to return to the previous view of the map. 3. Click on to expand the card and display all of its attributes. 4. Click on to minimize the card. 5. Click on to edit the element. This function is not yet available. 6. Click on to unselect the element. The other elements remain selected.
7
Instructions to help you select elements on the map. If you use the method described here, the elements selected using the search will be unselected.
The data table displays the attribute values of the selected elements in tabular form. The elements are listed in the tables lines, and their attributes are shown in the columns.
Click on to close the table. The elements remain selected.
Click on to open the table on a new tab. The table disappears from the tab in which the map is displayed.
Click on your browser's back button to return to the table displayed with the map.
You can sort the elements based on the values of a given attribute:
Hover the mouse pointer over the header of the column corresponding to the attribute you want to use to sort the data. An arrow displays next to the name of the attribute.
Click on the arrow to enable sorting. The arrow darkens and the elements are sorted in ascending order, based on their value for that attribute.
Click again to change the order. The arrow changes to and the elements are sorted in descending order.
You can also use the table to navigate between the selected elements:
Click on the line of an element in the table. That element is placed in the center of the map.
Click on to return to the previous view.


You can add annotations on the map, such as drawings or text, which can be saved in PDF format with the map.
The Annotations panel contains the application's drawing tools.
Click on to open the Annotations panel. The icon changes color .
1
Tools to add various types of annotations.
2
Select This button allows you to select annotations. Delete all This button allows you to delete annotations.
3
Fill These tools allow you to select the fill color and transparency for polygon type annotations. The section provides details on these tools.
4
Line These tools allow you to define the width, color, and transparency of lines. The section provides details on these tools.
5
Text These tools allow you to define the size, rotation, and color of text added to the map. The section provides details on these tools.
Click on the tool of your choice to enable it. The icon of the tool will change color. The Drawing tools section explains the features of these tools and how to use them.
Create the drawings you wish to add to the map. You can switch between tools to add different types of drawings. They will remain on the map until you delete them.
Several tools allow you to add annotations:
Point To draw points: 1. Click on to enable the tool. The icon changes color . 2. Click where you wish to add a point on the map. The appearance of points is defined in the and sections. You can select the features of points before drawing them. You can also of one or more points once they have been created.
Line 1. Click on to enable the tool. The icon changes color . 2. Click where you wish to add the first point of the line. 3. Click somewhere else to add a vertex to the line. 4. Double-click to complete the line. The appearance of lines is defined in the section. You can select the features of a line before drawing it. You can also of one or more lines once they have been created.
Circle 1. Click on to enable the tool. The icon changes color . 2. Click where you wish to draw the center of the circle. 3. Drag the pointer to draw the circle. 4. Click to complete the circle. The appearance of circles is defined in the and sections. You can select the features of a circle before drawing it. You can also of one or more circles once they have been created.
Rectangle 1. Click on to enable the tool. The icon changes color . 2. Click where you wish to draw the first vertex of the rectangle. 3. Drag the pointer to draw the rectangle. 4. Click to draw the opposite vertex and complete the rectangle. The appearance of rectangles is defined in the and sections. You can select the features of a rectangle before drawing it. You can also of one or many rectangles once they have been created.
Polygon 1. Click on to enable the tool. The icon changes color . 2. Click where you wish to draw the first vertex of the polygon. 3. Click to draw the vertices of the polygon. 4. Double-click to draw the last vertex and complete the polygon. The appearance of polygons is defined in the and sections. You can select the features of a polygon before drawing it. You can also of one or more polygons once they have been created.
Text 1. Click on to enable the tool. The icon changes color . 2. Click where you wish to add text on the map. The text entry interface opens. 3. Enter your text. 4. Click OK to save the text or click Cancel to close the interface without saving the text. The appearance of text is defined in the section. You can select the features of your text before entering it. You can also of one or more text entries once they have been created.
This section allows you to define the fill color and transparency for points, circles, rectangles, and polygons.
1
This box shows the selected color and its level of transparency. 1. Click on the box to open the fill color selection tool. This tool offers several ways to define the color.
2
Visual tools to select the color: 1. Select the color in the color bar by sliding the cursor. 2. Select the shade in the color field by sliding the point. The selected color is displayed in the Hex and RGB fields and also appears in the color box.
3
Hexadecimal (hex) code of the selected color. 1. Enter the hexadecimal code in the Hex field. The color you enter is shown in the box, in the colored bar, in the color field and in the RGB indicators. The Hexadecimal code is displayed in the Fill section at all times.
4
The color is also set using the RGB code. 1. Enter the R, G and B values of the desired color. All the color indicators display the selected color.
5
This field shows the level of opacity of the fill color. 1. Select the level of opacity in the second bar by sliding the cursor. Sliding the cursor completely to the right allows you to reach maximum opacity, and sliding it all the way to the left will set the value to maximum transparency. You can also enter the value in the A box. The level of opacity is displayed at all times as a percentage value in the Fill section.
6
The last selected colors are kepeed in memory.
This section allows you to define the appearance of lines that make up linear drawings as well as the outlines of circles, polygons, rectangles, and points.
1
Width To define the width of the line, select a value in the drop-down list.
2
This box displays the color selected for the line and its level of transparency. 1. Click on the box to open the line color selection tool. This tool offers several ways to define the color.
3
Visual tools to select the color: 1. Select the color in the color bar by sliding the cursor. 2. Select the shade in the color field by sliding the point. The selected color is displayed in the Hex and RGB fields and also appears in the color box.
4
Hexadecimal (hex) code of the selected color. 1. Enter the hexadecimal code in the Hex field. The color you enter is shown in the box, in the colored bar, in the color field and in the RGB indicators. The Hexadecimal code is displayed in the Line section at all times.
5
The color is also set using the RGB code. 1. Enter the R, G and B values of the desired color. All the color indicators display the selected color.
6
This field shows the level of opacity of the line. 1. Select the line's opacity level in the second bar by sliding the cursor. Sliding the cursor completely to the right allows you to reach maximum opacity, and sliding it all the way to the left will set the value to maximum transparency. You can also enter the value directly in the A box. The level of opacity is displayed at all times as a percentage value in the Line section.
7
The last selected colors are kepeed in memory.
This section allows you to define the appearance of text entered on the map.
1
Size To set the font size, select a value in the drop-down list.
2
Rotation Indicate the rotation angle you wish to apply to the text.
3
This box displays the color selected for the text. 1. Click on the box to open the text color selection tool. This tool offers several ways to define the color.
4
Visual tools to select the color: 1. Select the color in the color bar by sliding the cursor. 2. Select the shade in the color field by sliding the point. The selected color is displayed in the Hex and RGB fields and also appears in the color box.
5
Hexadecimal (hex) code of the selected color. 1. Enter the hexadecimal code in the Hex field. The color you enter is shown in the box, in the colored bar, in the color field and in the RGB indicators. The Hexadecimal code is displayed in the Text section at all times.
6
The color is also set using the RGB code. 1. Enter the R, G and B values of the desired color. All the color indicators display the selected color.
7
The last selected colors are kepeed in memory.
You can make changes to the annotations and drawings you add to the map. You can change the shape of one drawing at a time. You can change an annotation's appearance and its location, rotate or delete several drawings at once.
Click on Select to select the drawings or text entries you wish to modify.
Click on a text entry or a drawing to select it. The appearance of the drawing's lines will change, and the text will become bold, indicating that the annotation is selected.
Hold the SHIFT key and click on another drawing or text entry to add it to your selection. You can select several text entries or several drawings (circles, points, rectangles or polygons). You cannot select both text and drawings at the same time.
Depending on the type of annotation in your selection, and using the Fill, Line and Text tools, change the appearance of the annotations. The changes will be displayed on the map.
Click on another annotation or on the map to unselect the annotations.
Click on Select to select the drawings you want to modify.
Click on a drawing to select it. The vertices of the drawing appear.
Click on a vertex to select it. The vertex will turn black. New orange vertices are displayed between the original vertices.
Slide the selected vertex to the desired location. The drawing will be modified accordingly.
Make the changes by selecting the vertices you want to work with.
Click on another annotation, or click on the map to unselect the annotation.
You can change the location of annotations. You can only move one text entry at once, but you can move several drawings at the same time.
Click on Select to select the text entry you wish to move.
Click on a text entry to select it. The text becomes bold, indicating that it is selected.
Using the hand-shaped pointer, click on the text, then drag it to the desired location.
Drop the text.
Click on another annotation or on the map to unselect the text.
Click on Select to select the drawings you wish to move.
Click on a drawing to select it. The appearance of the drawing's lines will change, indicating that the annotation is selected.
Hold the SHIFT key and click on another drawing to add it to your selection.
Using the pointer that is shaped like a hand when it's on one of the drawings, drag the drawings to the desired location.
Drop the drawings.
Click on another annotation, or click on the map to unselect the drawings.
You can rotate a selection of drawings or a selection of texts. You cannot rotate a selection of drawings and texts.
Click Select to select the drawings or texts to rotate.
Click on a drawing or text to select it. The lines of the drawing or the appearance of the text change indicating that it is selected. The Rotate(1) button appears indicating an annotation to rotate.
Holding down the SHIFT key, click on another drawing/text to add it to the selection. The Rotate() button displays the number of selected annotations in parentheses.
Click Rotate. An interface opens to allow you to enter the angle of rotation to print to the selected drawings/texts.
Click OK. Drawings/texts are displayed with a rotation.
Click on Select to select the drawings or text entries you wish to delete.
Click on a text entry or a drawing to select it. The appearance of the drawing's lines will change, and the text will become bold, indicating that the annotation is selected.
Hold the SHIFT key and click on another text entry or drawing to add it to your selection. You can select several text entries or drawings (circles, points, rectangles or polygons). You cannot select both text and drawings at the same time. The Delete button indicates the number of selected annotations.
Click on Delete to delete the selected annotations.


You can provide startup options to the JMap NG Core library or the JMap NG App.
Those options let you customize the behaviour of JMap NG at startup.
You can pass those options as URL parameters:
https://jmapdoc.jmaponline.net/services/ng/?ngProjectId=57ec1ca5-ddb8-4c71-ace4-0571129b017c
Or pass them as a JS object, through a globally scoped JS variable named JMAP_OPTIONS, like this:
<script type="text/javascript">
window.JMAP_OPTIONS = {
projectId: "57ec1ca5-ddb8-4c71-ace4-0571129b017c",
restBaseUrl: "https://jmapdoc.jmaponline.net/services/rest/v2.0",
anonymous: true,
map: {
containerId: "my-custom-map",
zoom: 9.757829447748511,
center: {
x: -73.60243569463414,
y: 45.504533166207324
},
scaleControlVisible: true,
scaleControlPosition: "top-right"
}
}
</script>All options are available as JS parameters, and some are also available as URL parameters. All URL query parameters are prefixed with "ng", to avoid naming collisions with eventual third-party query parameters (especially true if JMap NG is embeded in a div for instance).
The following tables present the list of JMap NG Core library's startup options:
Option
Description
JavaScript Example
URL Parameter Example
Value
Login as anonymous user
If true, the lib will try to log in as an anonymous user. ()
anonymous: true
ngAnonymous=true
true | false
Default Basemap Id
If set, will use the basemap id as default basemap when loading a project. Using "none" will disable any default basemap.()
defaultBasemapId: "mapbox-satellite-streets"
ngDefaultBasemapId=mapbox-satellite-streets
string
Disable Basemaps
If true, no basemap will be available/displayed. In JMap NG App, no basemap panel will be displayed in the left panel. ()
disableBasemaps: true
ngDisableBasemaps= true
true | false
Disable project change
If true, changing project (after one has been loaded) will be disabled. ()
disableProjectChange: true
ngDisableProjectChange= true
true | false
Extensions
You can provide your own Core extensions. ()
{ extensions: [ … ] }
-
json / javascript
Extensions overrides
During the development of a project extension, you can use this option to load your local code instead of the project's extension's jsUrl. ()
{ extensionsUrlOverride: [ … ] }
-
json
Enable/Disable Geolocation
By default, the geolocation is activated (if the browser supports it). You can disable the geolocation by using this option. ()
geolocationEnabled: false
ngGeolocationEnabled =false
true | false
Disable UI visibility
If set to true, NG Core will not display a basic UI providing loading progress information, a login form and a project list. By default, this option is disabled in NG App. ()
hideMainLayout: true
-
true | false
Session language
If set to any of the locales supported by JMap NG, it will define the session locale, bypassing browser or user-defined locale. ()
locale: “en“
ngLocale=fr
string
Legacy authentication
If set to true, will revert to a REST API-based authentication setup
legacyAuthentication: true
ngLegacyAuthentication=true
boolean
Organization id
The JMap Cloud organization id. Used when passing a session refresh token (see below). ()
organizationId: "my-organization-id"
organizationId="my-organization-id"
string
Project thumbnails
If true will load all project thumbnails (base 64 images) asynchronously. ()
loadProjectThumbnails: true
-
boolean
Project id
Id of the JMap project to open. ()
projectId: 12
ngProjectId=12
number
Project name
Name of the JMap project to open. If both a project id and a project name are provided, project id will be used. ()
projectName: “World“
ngProjectName=The world url encoded => ngProjectName=World
string
Projects loaded callback
You can provide some JS code to be executed when all project definitions have been loaded from the backend. ()
onProjectsChange: (params) => console.log( params.projects )
-
javascript function() => void
Rest API URL
The Rest API URL of your JMap Server instance. ()
restBaseUrl: “https://api.jmapcloud.io/“
-
string
Session refresh token
A JMap Cloud refresh token used to initiate a session. If valid, will be used to identify the user. ). Using this option will automatically activate the legacy authentication.
token: “v1.MRq[.....]Rehef72YWws“
ngToken=v1.MRq[.....]Rehef72YWws
string
Map options are gathered in a "map" json object in the javascript configuration.
Option
Description
JavaScript Example
URL Parameter Example
Value
Map initial bearing
The initial bearing of the map (counterclockwise rotation). (). This option is overridden by the extent option
map: { bearing: 90 }
ngBearing=90
number
Center
Will center the map on the specified point. (). This option is overridden by the extent option
map: { center: { x: 12.4, y: 45.34 } }
-
json
Html container id
You can place the map in the HTML div of your choice by identifying the div in the map parameter. If not set, a div is appended in the body root. ()
map: { containerId: “my-div“ }
-
string
Extent
Will adjust the map to fit the extent. (sw = bbox south-west, ne = bbox north-east) (). This option has precedence over the following options: bearing, center, rotation and zoom
map: { extent: { sw: { x: 12.4, y: 45.34 }, ne: { x: 24.4, y: 55.34} } }
ngExtent=12.48|45.34 |24.4|55.34 url encoded => ngExtent=12.48%7C45.34 %7C24.4%7C55.34
json | string
Rotation control
By default, the map rotation control is visible, but can be hidden with this parameter. (). This option is overridden by the extent option
map: { mapRotation ControlVisible: true }
ngMapRotationControl Visible=false
true | false
Google Maps Api Key
This option is not yet available for JMap Cloud.
If no Google Maps API key is set in the JMap Cloud or JMap Server configuration, you can provide the API key as a JS parameter. The Google Maps API key is not mandatory, but if you don't provide one you won't have access to the Google Maps basemaps. (API doc)
map: { googleMapsApiKey: “Bse….32k“ }
-
string
Mapbox token
If no Mapbox access token is set in the JMap Cloud or JMap Server configuration, you can provide the token as a JS parameter. The Mapbox token is not mandatory, but if you don't provide one you won't have access to the Mapbox basemaps. ()
map: { mapboxToken: “xgb….4f5“ }
-
string
Navigation history control visibility
By default, the navigation history control is visible, but can be hidden with this parameter. ()
map: { navigationHistory ControlVisible: true }
ngNavigationHistory ControlVisible=true
true | false
Map ready callback
This function is triggered only once, the first time the map is loaded. ()
map: { onStartupMapReadyFn: map => { console.log(“The map is ready“, map) } }
-
javascript function(map: mapboxgl.Map) => void
Map initial rotation
The initial rotation of the map (clockwise rotation). ()
map: { rotation: 45 }
ngRotation=45
number
Scale-control position
The scale control position on the map. ()
map: { scaleControlPosition: “bottom-right“ }
-
“top-left” | “top-right” | “bottom-right” | “bottom-left”
Scale-control unit
The scale control unit. ()
map: { scaleControlUnit: “imperial“ }
-
imperial | metric | nautical
Scale-control visibility
By default, the scale control is visible, but can be hidden with this parameter. (
map: { scaleControlVisible: true }
ngScaleControlVisible=false
true | false
Map Info-control visibility
By default, the Map Info control is visible, but can be hidden with this parameter. ()
map: { mapInfoControlVisible: true }
ngMapInfoControlVisible=false
true | false
Terrain-control visibility
By default, the Terrain control is visible, but can be hidden with this parameter. (
map: { terrainControlVisible: true }
ngTerrainControlVisible=false
true | false
Search
When the map is loaded, will execute a search by attribute(s) on the layer, and zoom to the matching features. You can search using multiple attribute values by passing an array in the javascript form, or by passing trailing values in the URL form. An optional parameter lets you specify to display a MouseOver popup on the result feature. This popup will only be displayed if the showMapPopup parameter is true, and if there is only one result to the search. In the URL form, showMapPopup must be passed as a keyword, and at the beginning of the query string ()
map:{ search: { layerId: 2, attributeName: “PEC“, attributeValue: [“RT 201“, "RT 202"], showMapPopup: true } }
ngSearch=showMapPopup |2|PEC|RT 201|RT 202 url encoded => ngSearch=showMapPopup %7C2%7CPEC %7CRT%20201 %7CRT%20202
json | string
Zoom level
The initial zoom level of the map. (). This option is overridden by the extent option
map: { zoom: 5.3456 }
-
number
The following table presents the list of JMap NG App's startup options:
Option
Description
JavaScript Example
URL Parameter Example
Value
Div container id
You can choose the div where the application (and the map) will be rendered in your page. ()
application: { containerId: “my-app“, … }
-
string
Disable panels
Will disable (and hide) the specified panels. Specifying "all" will hide all panels and remove the side menu ()
application: { disabledPanels: [ “print“, “mapcontext“ ], … }
ngDisabledPanels= print,mapcontext
Array | string
Extensions
You can provide your own application extensions . See the examples section for details. ()
application: { extensions: [ … ] }
-
json / javascript
Login screen background image
You can set a custom background image for the login screen by setting an image url. This image will be displayed to the left of the JMap NG login form. (). Only effective when using legacy authentication
application: { loginBackgroundImageUrl: “http://my-server/my-image“, … }
-
string
Logo image
You can set a custom logo image by setting an image url. The logo will be displayed above the JMap NG login form. (). Only effective when using legacy authentication
application: { logoImageUrl: “http://my-server/my-image“, … }
-
string
App loaded callback
You can provide JS code that will be executed when the app is ready. ()
application: { onAppLoad: () => console.log(“App is loaded“), … }
-
javascript function() => void
App unloaded callback
You can provide JS code that will be executed when the app is unloaded. ()
application: { onAppUnload: () => console.log(“App is not loaded anymore“), … }
-
javascript function() => void
Display a panel
Will show the specified panel at startup. ()
application: { panel: “query“, … }
ngPanel= selection
"layer" | "selection" | "measure" | "mapcontext"| "print" | "user" | "query" | "annotation" | "geometry"
Project list background image
You can set a custom background image for the project list screen by setting an image url. This image will be displayed to the left of the project list. ()
application: { projectBackgroundImageUrl: “http://my-server/my-image“, … }
-
string
Initial side panel visibility
Controls side panel initial visibility. ()
application: { sidePanelInitialVisibility: false, … }
ngSidePanelInitialVisibility= false
true | false
Simple Search control visibility
By default, the Simple Search control is visible, but can be hidden with this parameter. ()
application: { simpleSearchControlVisible: false, … }
ngSimpleSearchControlVisible=false
true | false
Geocoding control visibility
By default, the Geocoding control is visible, but can be hidden with this parameter. ()
application: { geocodingControlVisible: false, … }
ngGeocodingControlVisible=false
true | false
Theme
Will set the theme, dark or light. ()
application: { theme: “light“, … }
ngTheme=light
light | dark
JMap NG extensions are plug-in modules taht can exetend the functionalities present in JMap NG App. You can develop and add your own extensions.
For more information about JMap NG extensions, refer to this .
The JMap NG App extension API documentation is available .
The example bellow shows a simple extension that creates a panel and displays some text on it.
Try it out in
There is another way to load your extension, after the JMap NG App has been loaded.
You can register the previous extension like this:
The example bellow shows you a more sophisticated extension named "Favourite locations".
It adds points on the map where you click, and displays a list of your "favourite" locations. You can also toggle the visibility of the point layer.
Try it out in
<!DOCTYPE html>
<html>
<head>
<meta http-equiv="Content-Type" content="text/html;charset=UTF-8">
<meta charset="UTF-8">
<style>
html,
body {
padding: 0px;
margin: 0px;
height: 100%;
width: 100%;
}
</style>
</head>
<body>
<script type="text/javascript">
const extensionId = "my-extension"
window.JMAP_OPTIONS = {
restBaseUrl: "https://jmapdoc.jmaponline.net/services/rest/v2.0",
anonymous: true,
projectId: 1,
map: {
center: {
x: -74.17355888315548,
y: 45.504030591808856
},
zoom: 8.04872607654608
},
hideMainLayout: true,
application: {
panel: `${extensionId}-panel`,
extensions: [{
id: extensionId,
panelIcon: "fa-unlock-alt", // this is a font-awesome icon, but you can pass an image url
panelTitle: "My custom extension",
panelTooltip: "My custom extension",
onPanelCreation: containerId => {
const container = document.getElementById(containerId)
const span = document.createElement("span")
span.id = "my-text"
span.innerHTML = "This is a custom panel"
container.append(span)
},
onPanelDestroy: (containerId) => {
document.getElementById(containerId)
const text = document.getElementById("my-text")
if (text) {
text.remove()
}
}
}]
}
}
</script>
<script defer type="text/javascript" src="https://cdn.jsdelivr.net/npm/jmap-app-js@7_Kathmandu_HF3"></script>
</body>
</html>JMap.Application.Extension.register({
id: "my-extension",
panelIcon: "fas fa-wrench",
panelTitle: "My custom extension",
panelTooltip: "My custom extension",
onPanelCreation: containerId => {
const container = document.getElementById(containerId)
const span = document.createElement("span")
span.id = "my-text"
span.innerHTML = "This is a custom panel"
container.append(span)
},
onPanelDestroy: (containerId) => {
document.getElementById(containerId)
const text = document.getElementById("my-text")
if (text) {
text.remove()
}
}
})<!DOCTYPE html>
<html>
<head>
<meta http-equiv="Content-Type" content="text/html;charset=UTF-8" />
<meta charset="UTF-8" />
<style>
html,
body {
padding: 0px;
margin: 0px;
height: 100%;
width: 100%;
}
</style>
</head>
<body>
<script type="text/javascript">
function getFavouriteExtension(extensionId) {
const LAYER_ID = "favourite-custom-layer"
const CLICK_LISTENER_ID = "favourite-click-listener"
const ACTION_ADD = "FAVOURITE_ADD_LOCATION"
const ACTION_DEL = "FAVOURITE_DEL_LOCATION"
const ACTION_SET_VISIBILITY = "FAVOURITE_SET_LAYER_VISIBILITY"
let panelContainerId
let visibilityContainerId
let locationsContainerId
let reduxUnsubscribe
let map
let previousLocationCount = 0
let previousLayerVisibility = true
// return the JMap application current redux state
function getAppState() {
return JMap.getDataStore().getState().external["jmap_app"]
}
// return the favourite extension current redux state
function getFavouriteState() {
return JMap.getDataStore().getState().external[extensionId]
}
// return the primary color in use by JMap Application
function getPrimaryColor() {
return getAppState().ui.theme.palette.text.primary
}
// return the secondary color in use by JMap Application
function getSecondaryColor() {
return getAppState().ui.theme.palette.text.secondary
}
/**
* This is the favourite service.
* It is where we change the redux store values,
* then the reduxChangeHandler function will react to state changes.
**/
const favouriteSVC = {
// returns all existing locations
getLocations: () => getFavouriteState().locations.slice(),
// return true if the layer is displayed on the map
getLayerVisibility: () => getFavouriteState().isLayerVisible,
// add a location in the redux store
add: location =>
JMap.getDataStore().dispatch({
type: ACTION_ADD,
location: location
}),
// remove a location in the redux store at the index
del: index =>
JMap.getDataStore().dispatch({
type: ACTION_DEL,
index: index
}),
// if false, hide the layer on the map, else show it
setLayerVisibility: visibility =>
JMap.getDataStore().dispatch({
type: ACTION_SET_VISIBILITY,
visibility: visibility
})
}
/**
* This is the redux reducer, a pure javascript function.
* It reacts to the actions you dispatch, and changes the data in the store.
**/
function reduxReducer(currentFavouriteState, action) {
if (!currentFavouriteState) {
currentFavouriteState = {
locations: [],
isLayerVisible: previousLayerVisibility
}
}
switch (action.type) {
case ACTION_ADD: {
const newFavouriteState = { ...currentFavouriteState, locations: currentFavouriteState.locations.slice() }
newFavouriteState.locations.push(action.location)
return newFavouriteState
}
case ACTION_DEL: {
const newFavouriteState = { ...currentFavouriteState, locations: currentFavouriteState.locations.slice() }
newFavouriteState.locations.splice(action.index, 1)
return newFavouriteState
}
case ACTION_SET_VISIBILITY: {
return { ...currentFavouriteState, isLayerVisible: action.visibility }
}
}
return currentFavouriteState
}
// Create the dom elements to display the layer visibility checkbox
function displayLayerVisibility() {
if (!visibilityContainerId) {
visibilityContainerId = `${panelContainerId}-visibility`
}
const panelContainer = document.getElementById(panelContainerId)
panelContainer.style.color = getPrimaryColor()
panelContainer.style.padding = "1rem"
const container = document.createElement("div")
container.id = visibilityContainerId
const span = document.createElement("span")
span.innerHTML = "Display locations on map"
container.append(span)
const input = document.createElement("input")
input.type = "checkbox"
input.style.cursor = "pointer"
input.style.marginLeft = "1rem"
input.checked = favouriteSVC.getLayerVisibility()
input.onclick = () => favouriteSVC.setLayerVisibility(!favouriteSVC.getLayerVisibility())
container.append(input)
panelContainer.append(container)
}
// Create the dom elements to display the locations list
function displayLocations() {
if (!locationsContainerId) {
locationsContainerId = `${panelContainerId}-locations`
}
const panelContainer = document.getElementById(panelContainerId)
const container = document.createElement("div")
container.id = locationsContainerId
container.style.marginTop = "1rem"
container.style.display = "flex"
container.style.flexDirection = "column"
const locations = favouriteSVC.getLocations()
if (locations.length === 0) {
const span = document.createElement("span")
span.innerHTML = "Click on the map to add your favourite locations"
span.style.color = getSecondaryColor()
container.append(span)
} else {
for (var i = 0; i < locations.length; i++) {
const location = locations[i]
const index = i
const locationContainer = document.createElement("div")
locationContainer.style.marginTop = "1rem"
locationContainer.style.display = "flex"
locationContainer.style.alignItems = "center"
locationContainer.style.justifyContent = "space-between"
const locationSpan = document.createElement("span")
locationSpan.innerHTML = `LNG = ${location.x.toFixed(5)} | LAT = ${location.y.toFixed(5)}`
locationContainer.append(locationSpan)
const button = document.createElement("button")
button.innerHTML = "X"
button.title = "Click to remove the location"
button.style.cursor = "pointer"
button.onclick = () => favouriteSVC.del(index)
locationContainer.append(button)
container.append(locationContainer)
}
}
panelContainer.append(container)
}
// Remove in the dom the container, given the container id
function removeContainer(containerId) {
const container = document.getElementById(containerId)
if (container) {
container.remove()
}
}
function refreshLocations() {
removeContainer(locationsContainerId)
displayLocations()
}
// Locations have changed in the store, we add or remove it in the mapbox source.
function refreshLayer() {
map.getSource(LAYER_ID).setData({
type: "FeatureCollection",
features: getFavouriteState().locations.map(l => ({
type: "Feature",
geometry: { type: "Point", coordinates: [l.x, l.y] }
}))
})
}
/**
* The redux function that is called when the redux state changed.
* If a favourite value has changed it refreshes the ui or the map.
**/
function reduxChangeHandler() {
const state = getFavouriteState()
if (previousLocationCount !== state.locations.length) {
previousLocationCount = state.locations.length
refreshLocations()
refreshLayer()
}
if (previousLayerVisibility !== state.isLayerVisible) {
previousLayerVisibility = state.isLayerVisible
map.setLayoutProperty(LAYER_ID, "visibility", state.isLayerVisible ? "visible": "none")
}
}
/**
* The map interactor, more details on:
* https://k2geospatial.github.io/jmap-app/latest/modules/jmap.map.interaction.html
**/
const mapInteractor = {
init: mapboxMap => {
map = mapboxMap
map.addSource(LAYER_ID, {
type: "geojson",
data: { type: "FeatureCollection", features: [] }
})
map.addLayer({
id: LAYER_ID,
type: "circle",
source: LAYER_ID,
paint: {
"circle-radius": 10,
"circle-color": "#0066ff"
}
})
JMap.Event.Map.on.click(CLICK_LISTENER_ID, params => {
favouriteSVC.add(params.location)
})
JMap.Event.Map.deactivate(CLICK_LISTENER_ID)
},
activate: () => {
JMap.Map.getMap().doubleClickZoom.disable()
JMap.Event.Map.activate(CLICK_LISTENER_ID)
},
deactivate: () => {
JMap.Map.getMap().doubleClickZoom.enable()
JMap.Event.Map.deactivate(CLICK_LISTENER_ID)
},
terminate: () => {
JMap.Event.Map.remove(CLICK_LISTENER_ID)
map.removeLayer(LAYER_ID)
map.removeSource(LAYER_ID)
}
}
// Returns the extension object that will be registered by the JMap Application
return {
id: extensionId,
panelIcon: "fa-thumbtack",
panelTitle: "My favourite locations",
panelTooltip: "My favourite locations",
onPanelCreation: containerId => {
if (!panelContainerId) {
panelContainerId = containerId
}
displayLayerVisibility()
displayLocations()
reduxUnsubscribe = JMap.getDataStore().subscribe(reduxChangeHandler)
},
onPanelDestroy: () => {
removeContainer(visibilityContainerId)
removeContainer(locationsContainerId)
reduxUnsubscribe()
},
interactor: mapInteractor,
serviceToExpose: favouriteSVC,
storeReducer: reduxReducer
}
}
const extensionId = "favourite"
window.JMAP_OPTIONS = {
restBaseUrl: "https://jmapdoc.jmaponline.net/services/rest/v2.0",
anonymous: true,
projectId: 1,
map: {
center: {
x: -73.92251114687645,
y: 45.52559621002098
},
zoom: 9.07038517536697
},
hideMainLayout: true,
application: {
panel: `${extensionId}-panel`, // will display the favourite panel when application starts
extensions: [getFavouriteExtension(extensionId)] // will register the favourite extension
}
}
</script>
<script defer type="text/javascript" src="https://cdn.jsdelivr.net/npm/jmap-app-js@7_Kathmandu_HF3"></script>
</body>
</html>